Data below descibe testing of variouse conditions. Different amount of template, different template, annealing temperature, different enzyme and different PCR voulme. The primer labeled as Sarbeco is the same set as #21. The following PDF file is recordings in Julia Elisabeth Simensen digital lab journal (Covid-19 project).
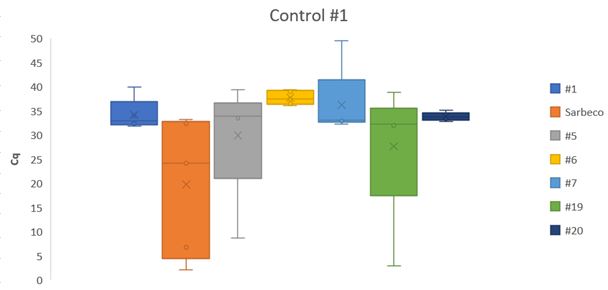
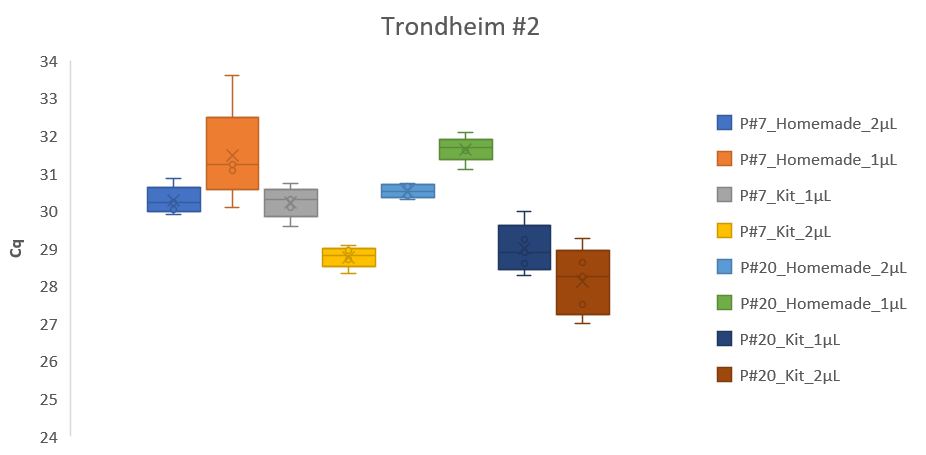
Box plot of Cq values from the first one-tube RT-PCR setup.
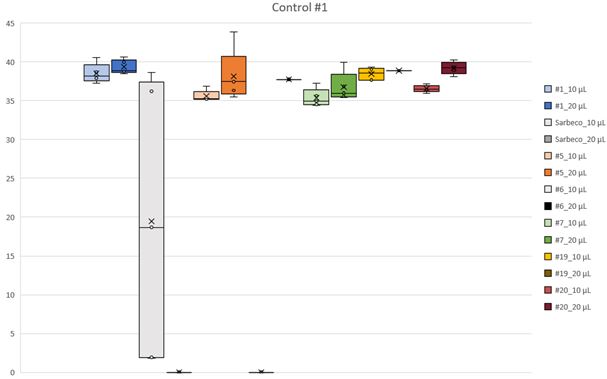
Test of reaction volume, 10 or 20µl.
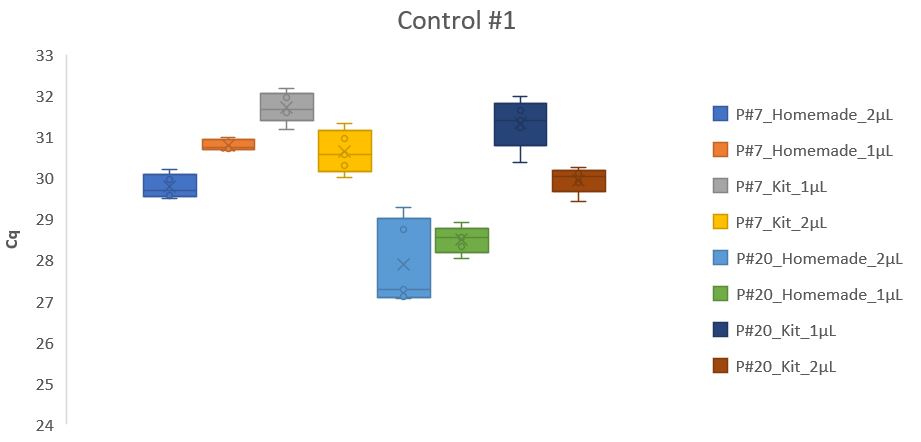
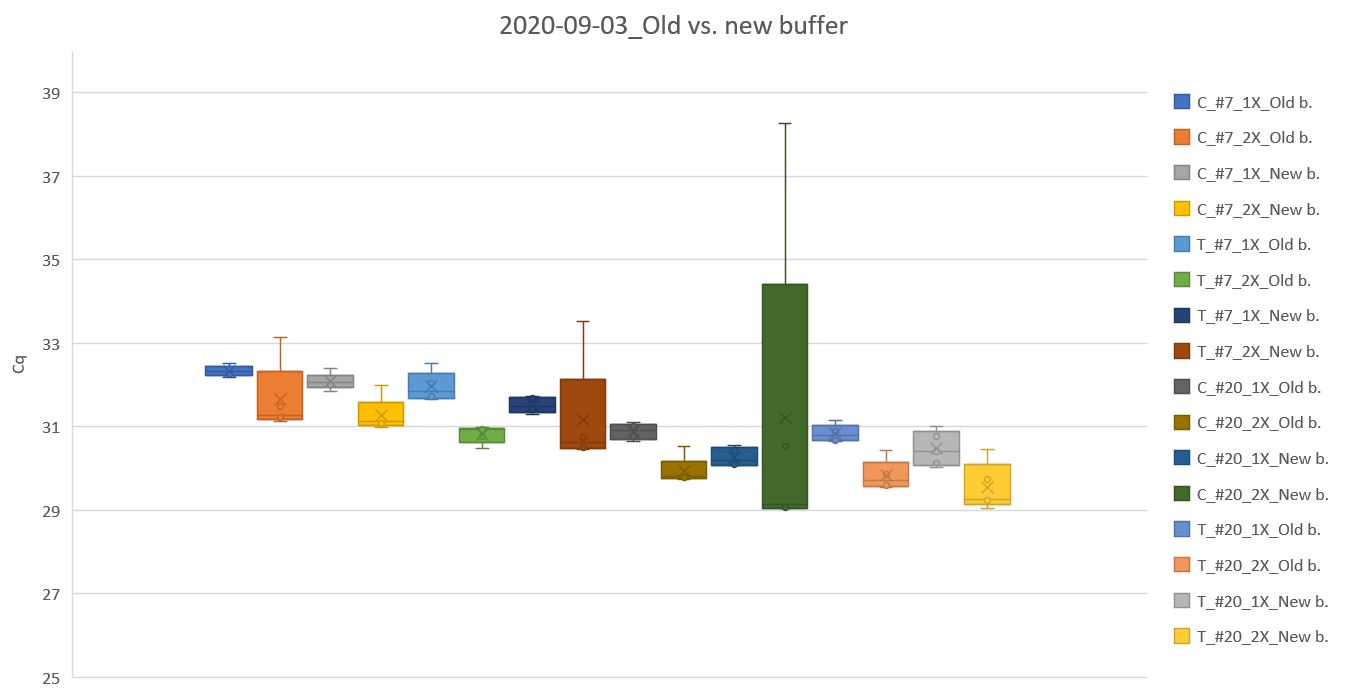
First graph, box plot of Cq values when different amounts of cDNA from Control #1 RNA was used with primer set #7 or #20, and with different types of buffers. Second graph, (same conditions Control#1), except for the template. The template was made on RNA from Trondheim (purified RNA, received from Dr. Magnar Bjørås).
Comparison of two different batches of buffer
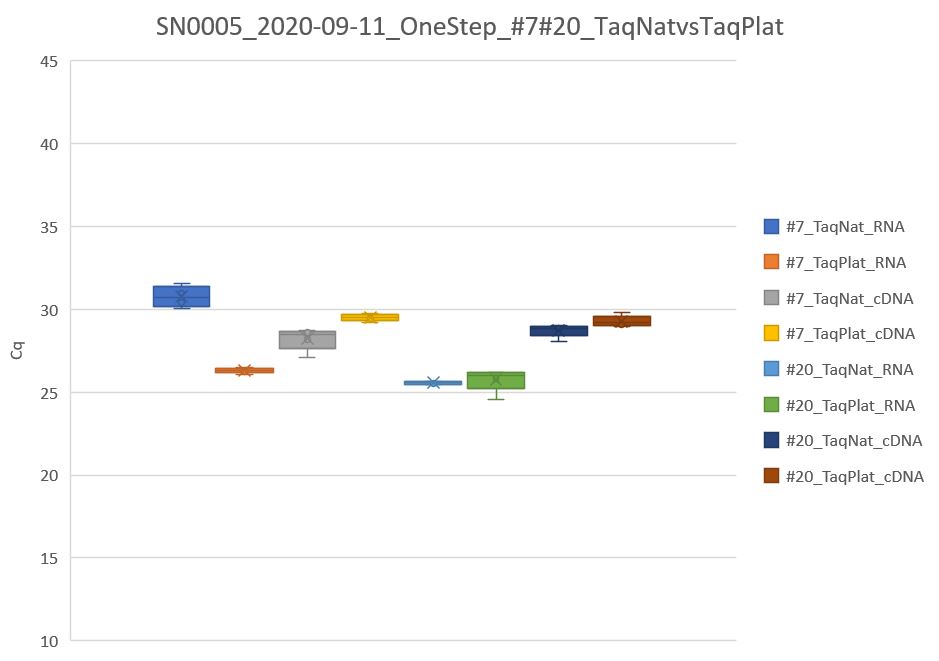
Comparison of in-house native Taq vs. commercial platinum Taq, with RNA or cDNA as starting material.
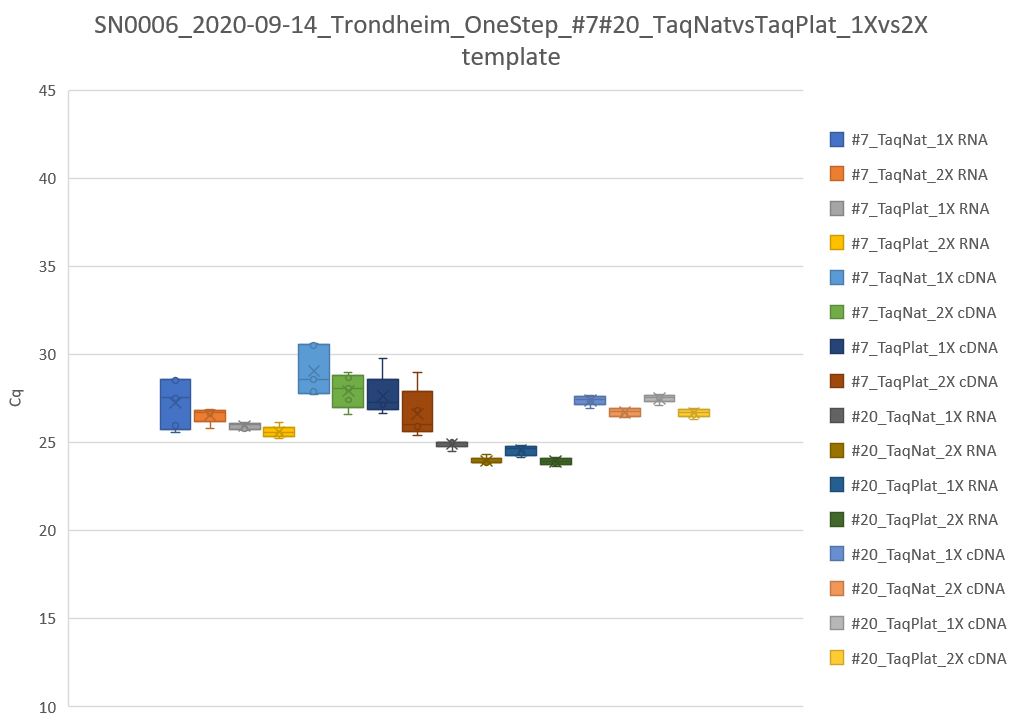
Comparison of in-house native Taq vs. commercial platinum Taq, with different amount of RNA or cDNA as starting material.
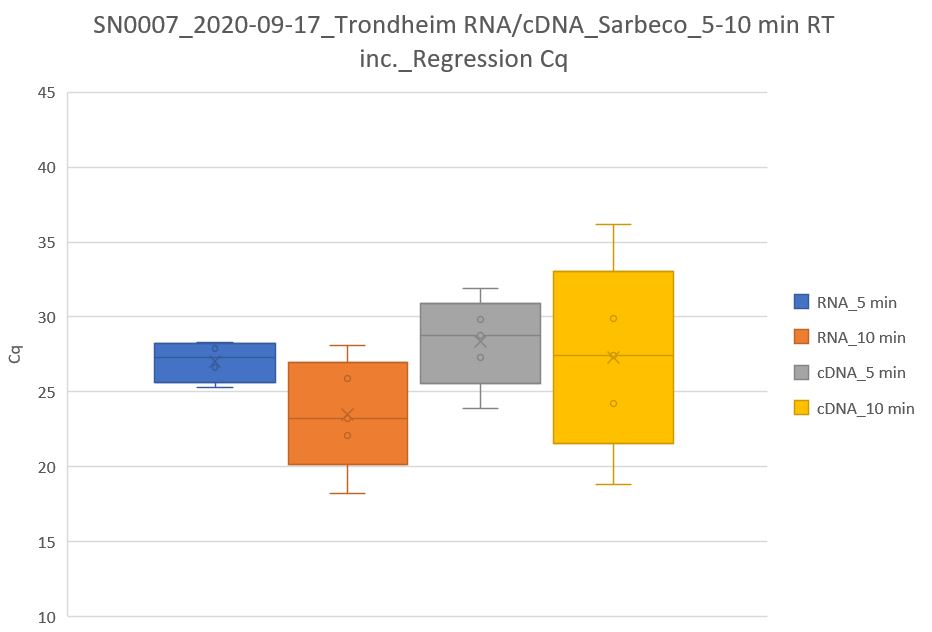
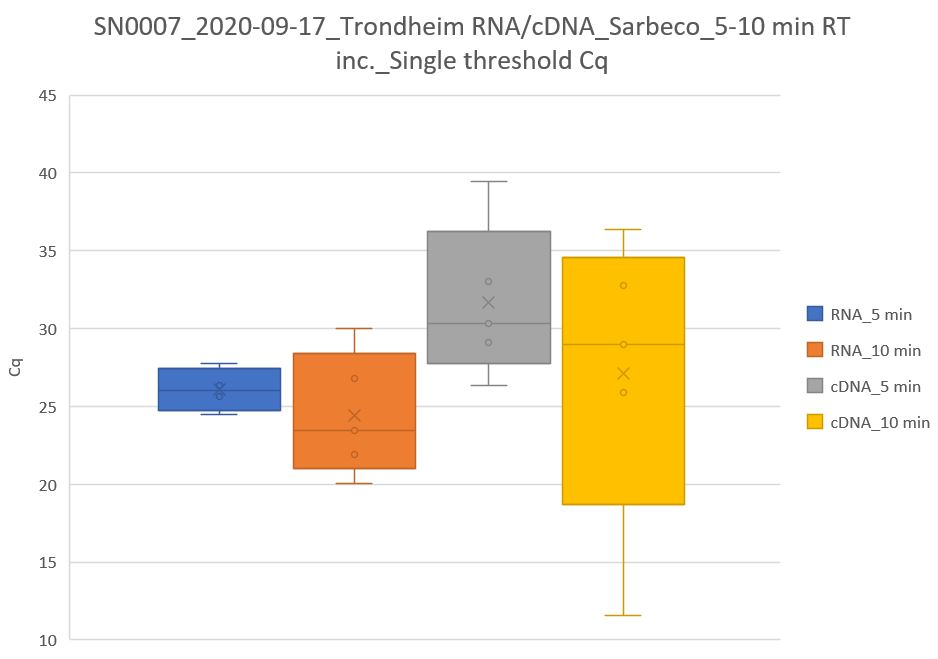
Effect of cDNA synthesis time in one tube reactions. Cq values determined by regression or single theshold.
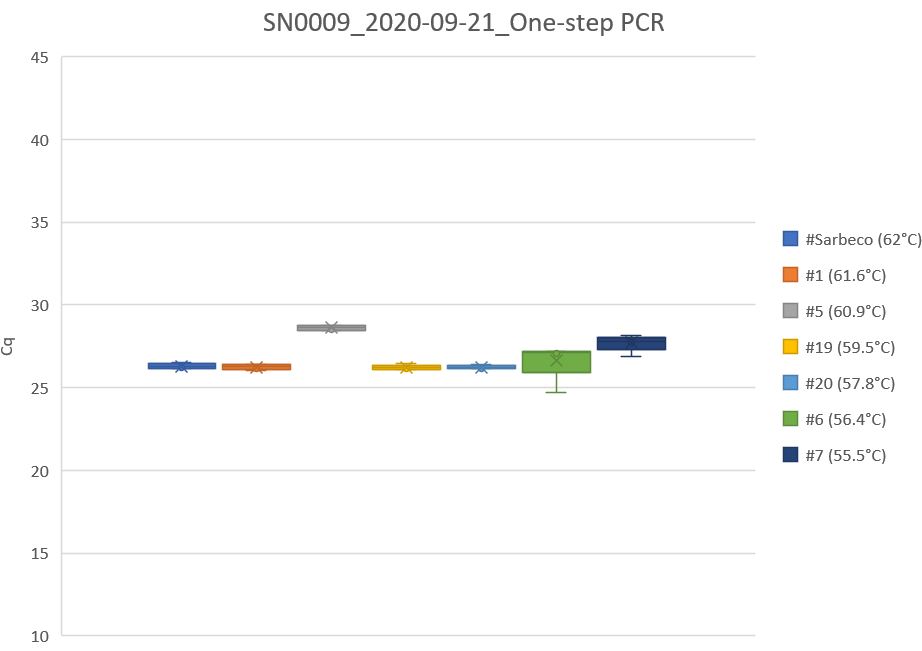
One tube reaction on seven different primersets.
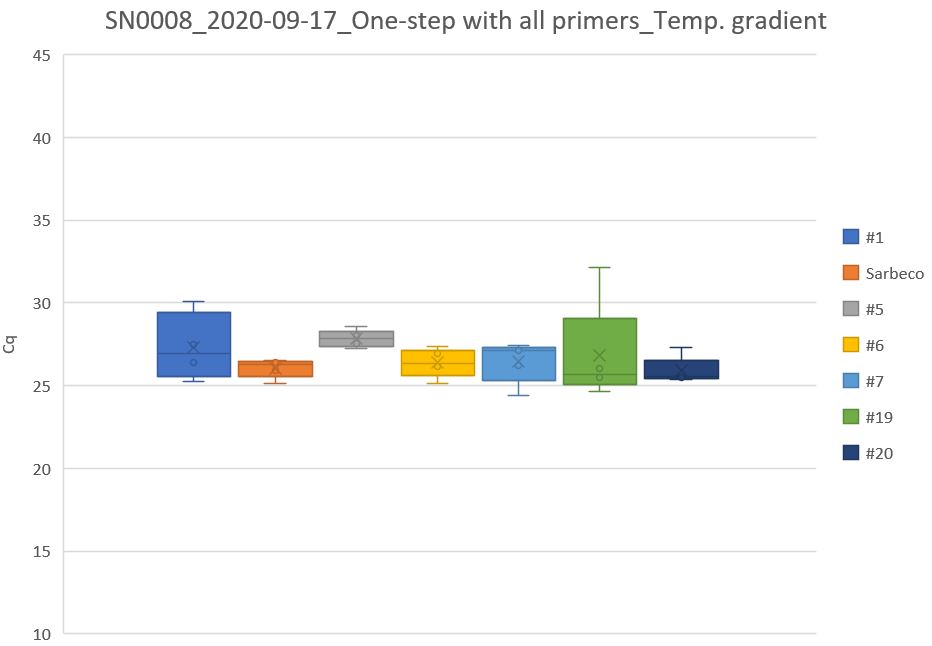
The graph shows optimal temperature for annealing during RT-PCR for each primer/probe set.
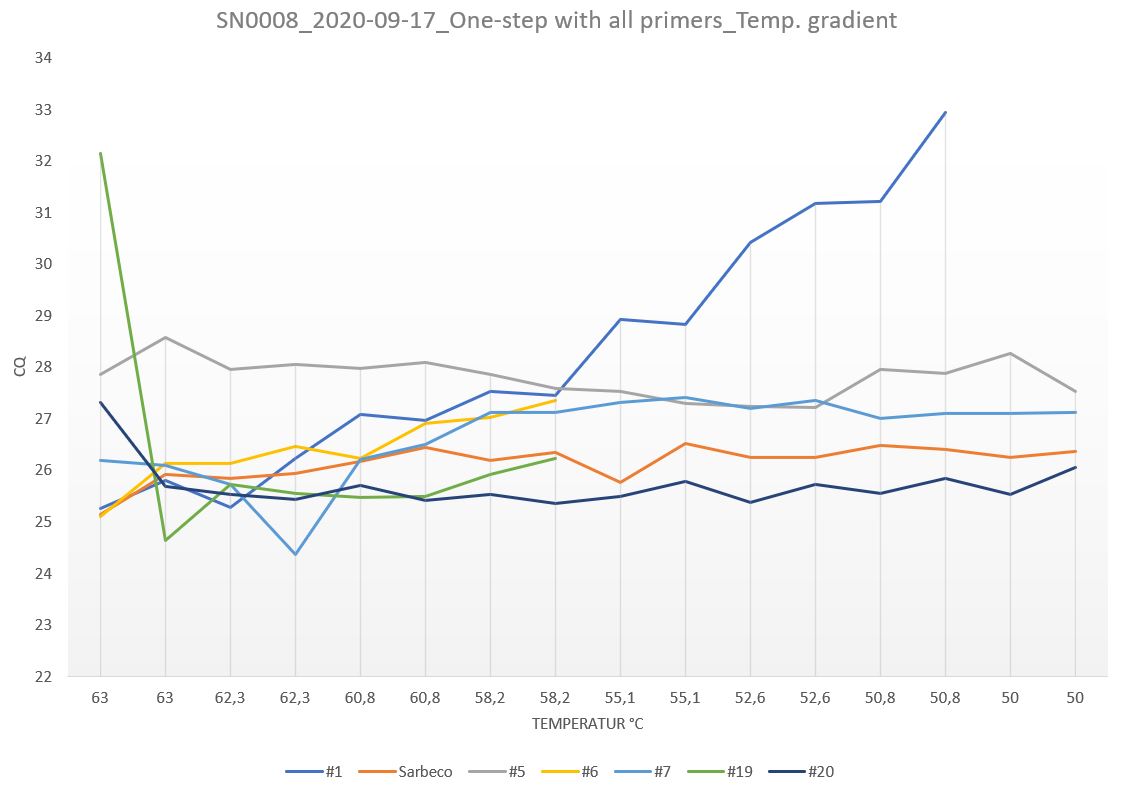
A temperature gradient was used on the PCR machine to accommodate the different annealing temperature for each primer set. The plate layout is shown below.
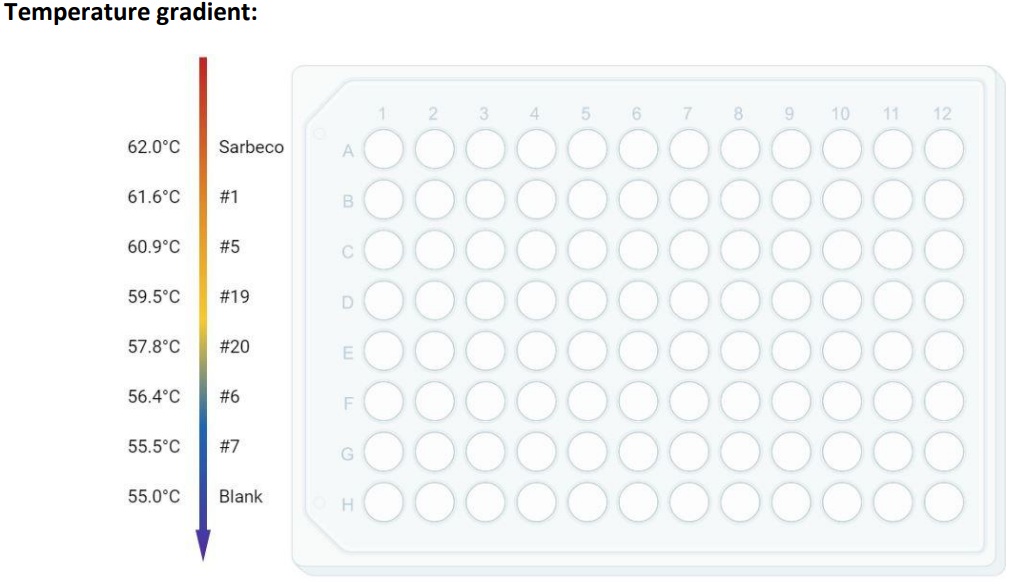
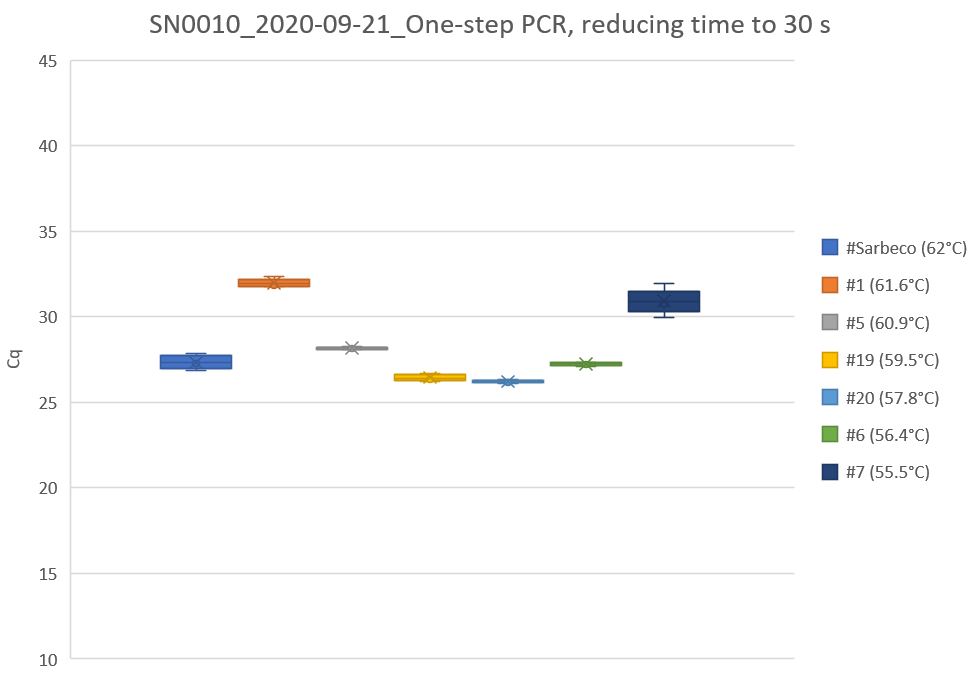
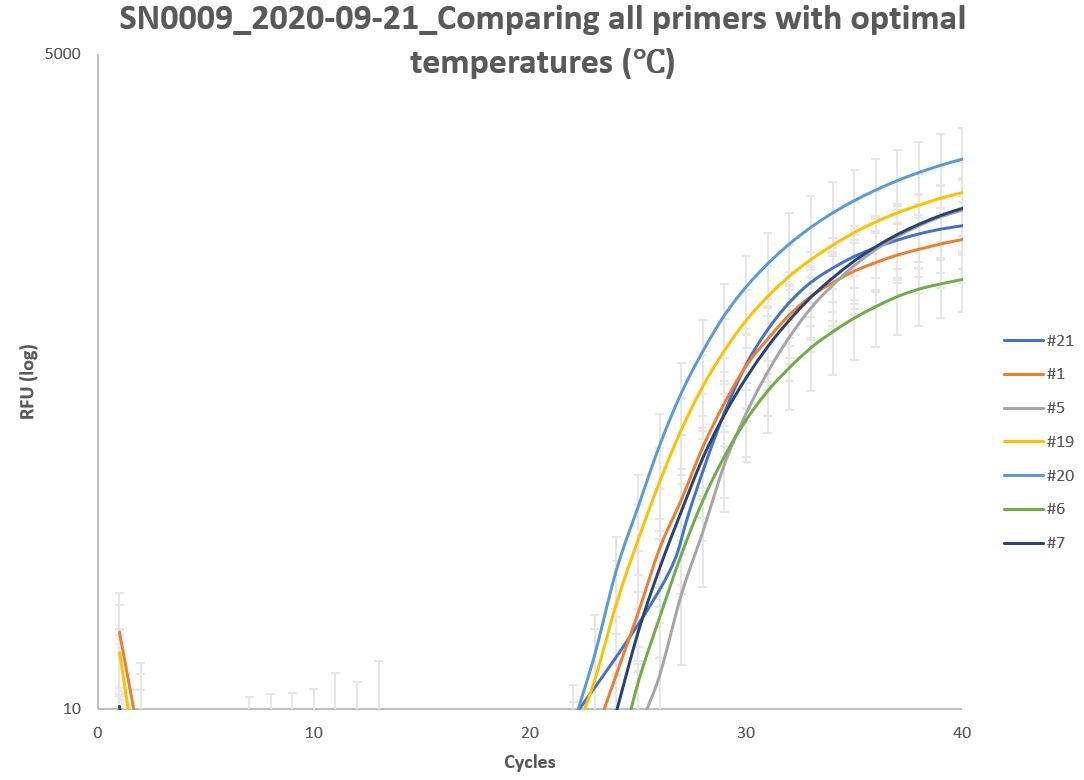
One step rtPCR on Sars-cov-2 RNA with in-house chemistry. The "optimal" annealing temperature is shown next to the primerset figure legende.
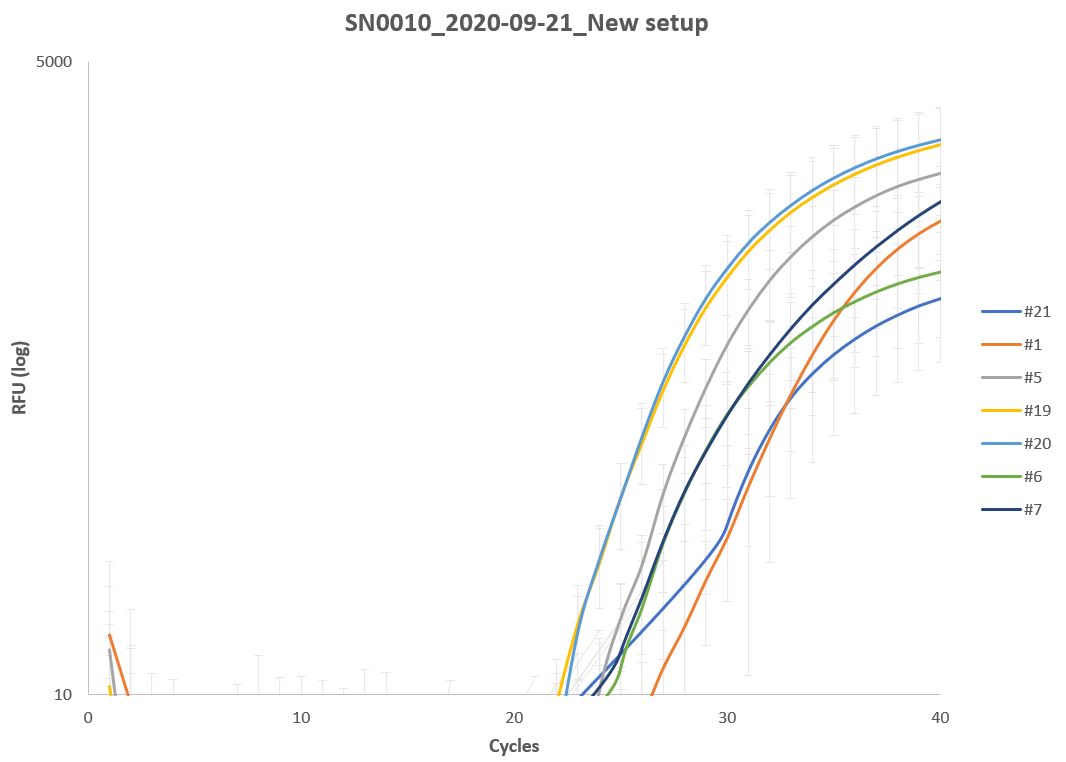
Amplification curves for seven different primer/probe sets. Average and 1 standard deviation of twelve technical replicates.
Slight modification of the "extension time" from 60second to 30 second. this reduced the running time.
Avreage Cq value from the graph above-