Sample #170 Breast tumor (breast cancer)

Overview
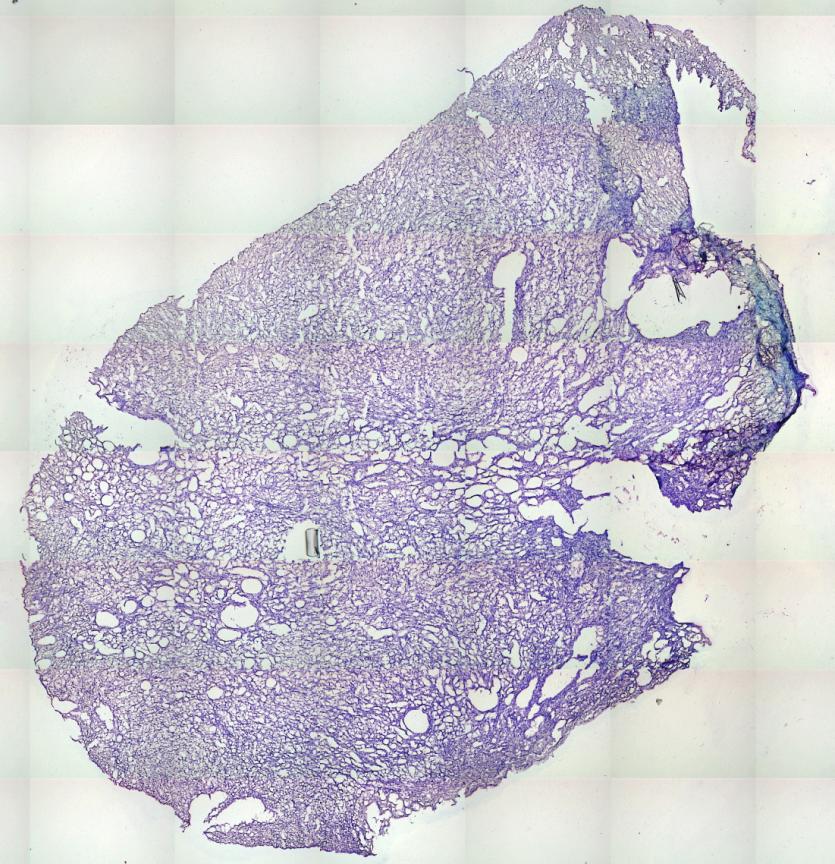 |
This sample had limited amount of tissue, thus only 6 consecutive 12μm microtome slides were placed on membrane suitable for laser capture microdissection (LCMD). A grid of 96 (~25000 μm2) circles was used as a template for the laser capture microdissection on each membrane slide. This sample has a corresponding lymph node and liver metastases. An attempt was also made to insert a guide object (plastic string) that could be followed through the tissue (click on the picture for enlargement).
Descriptive statistics of mutant fraction found in each LCMD sample.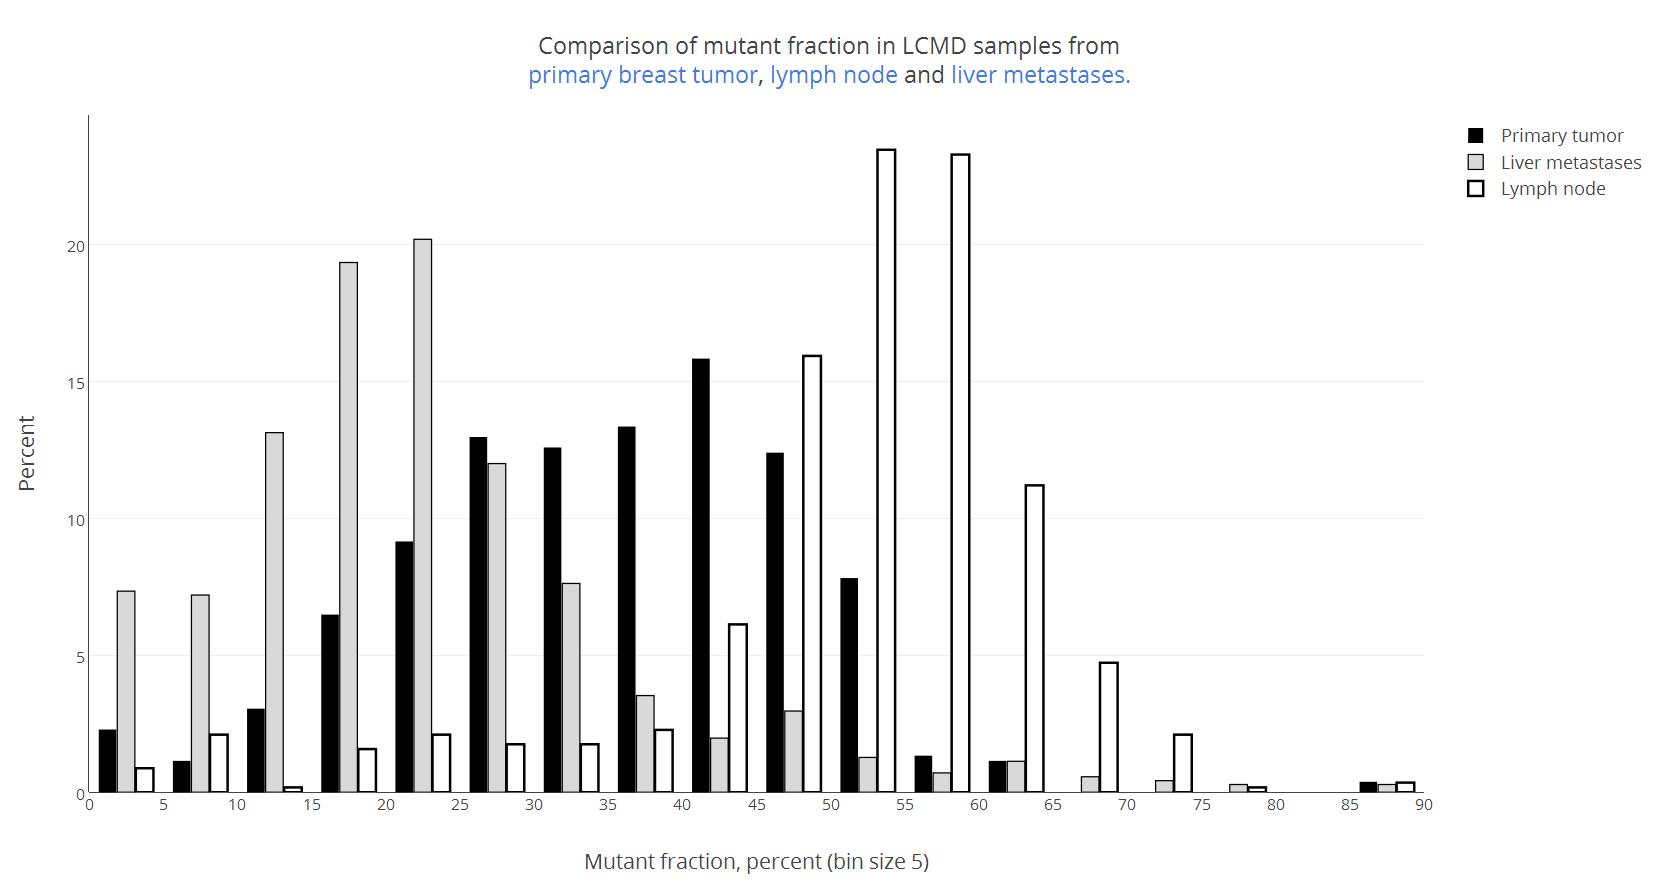
| Marker P1F1 | Prime tumor |
Liver met | Lymph node |
| N | 524 | 708 | 571 |
| Min (%) | 0 | 0 | 0 |
| Max (%) | 86.8 | 89.6 | 89.2 |
| Mean (%) | 34.9 | 22.3 | 50.8 |
| First Quantile (%) | 26.0 | 14.2 | 47.5 |
| Median (%) | 36.4 | 20.5 | 53.1 |
| Third Quantile (%) | 44.3 | 27.4 | 58.6 |
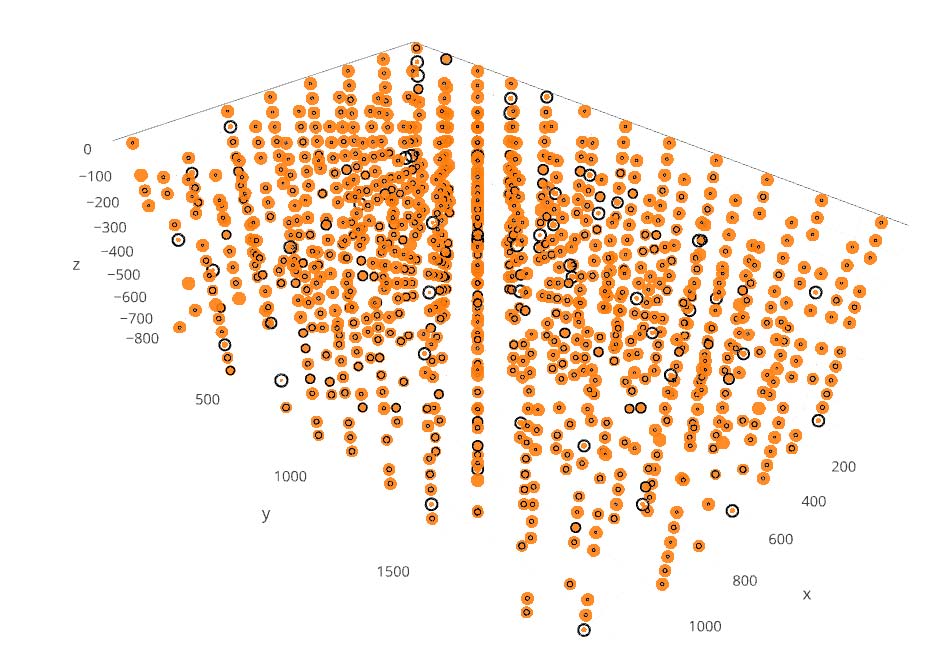
Links to 3 different approaches to visualizing the mutant fraction in the3D volume.
Isosurfaces of a random spread of homoplasmic cells (wild-type and/or mutant) in each LCMD volumes.
| P1F1 | Non-mutated | Mutated |
Isosurfaces of mutant fractions from 5% to 85% in 5% point increments.
| 35% | 70% | |
| 5% | 40% | 75% |
| 10% | 45% | 80% |
| 15% | 50% | 85% |
| 20% | 55% | |
| 25% | 60% | |
| 30% | 65% |
3D bubble plot of wild-type and mutant fractions.