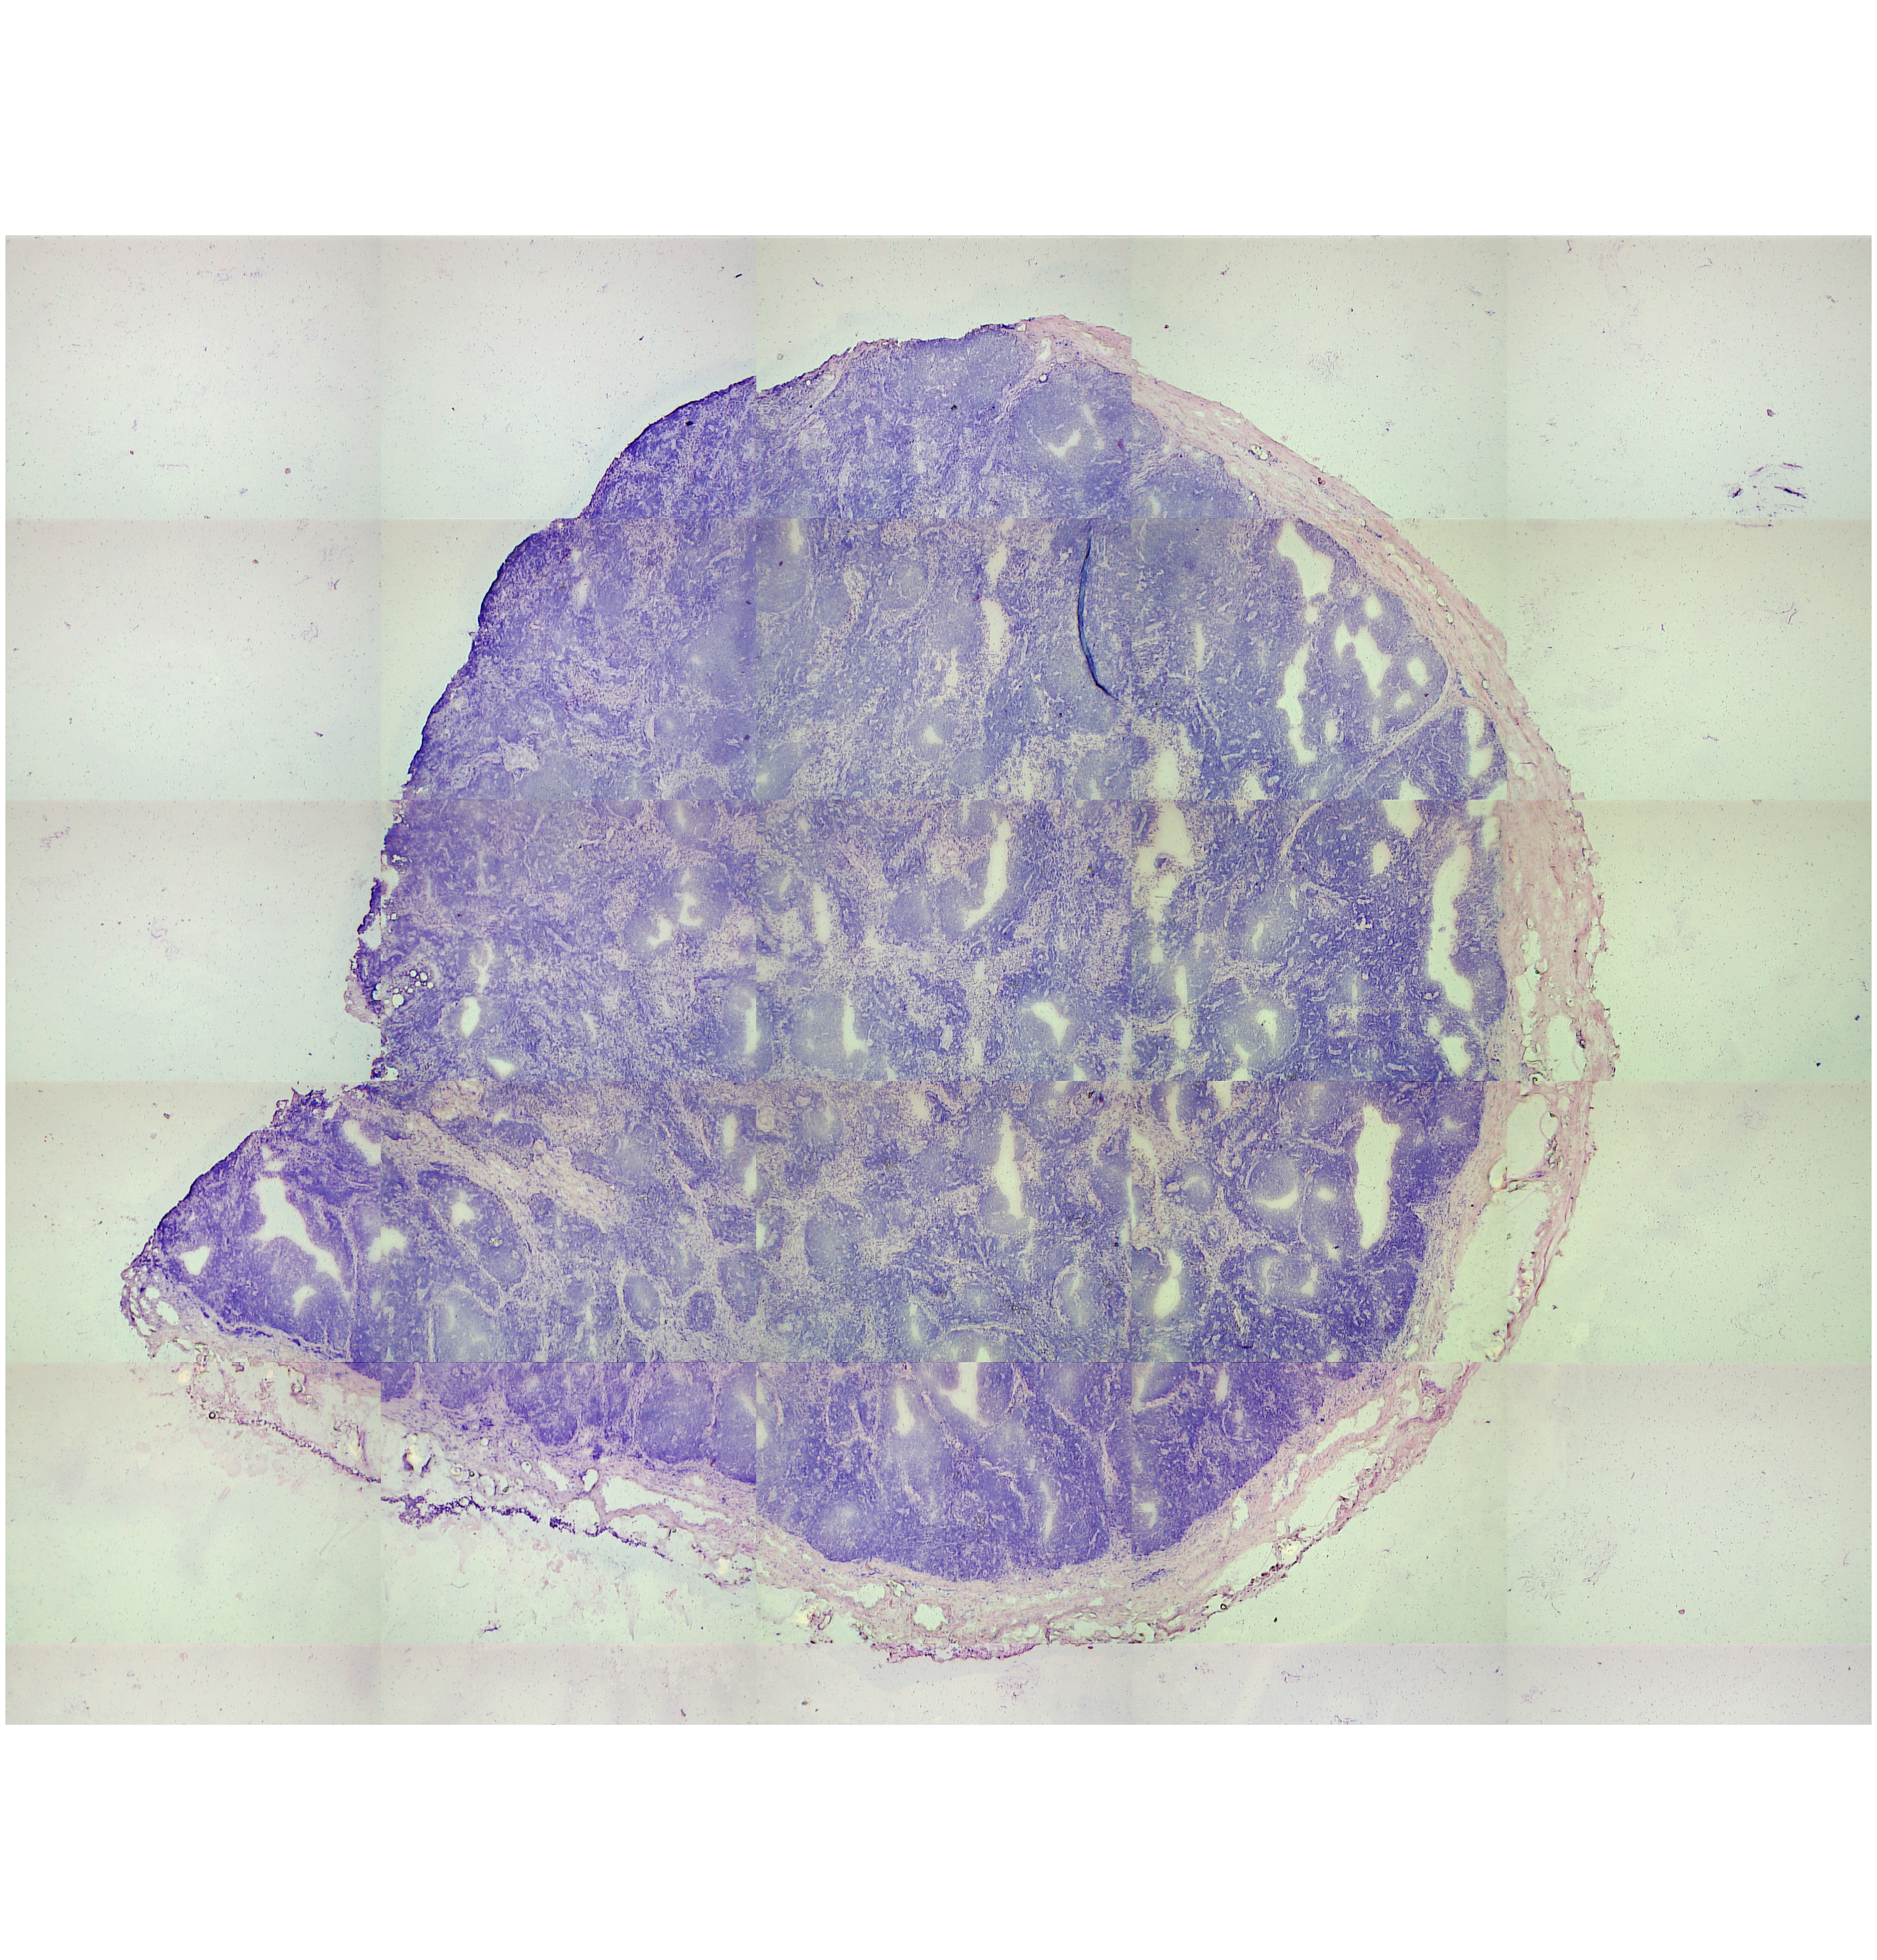
Sample #231 Lymph node (from patient with bladder cancer)

Overview of tissue (cut 26 before and after LCMD)
 |
 |
The sample was mounted and cut in a cryotome. 70 microtome slices, of 12 μm thickness were cut from the tissue. Every 5th cut was placed on membrane suitable for laser capture microdissection (LCMD), the 4 slices in between were placed on glass slides. A grid of 96 (~25000 μm2) circles was used as a template for the laser capture microdissection on each membrane slide. Pictures of slices and LCMD cuts can be found at the following link.
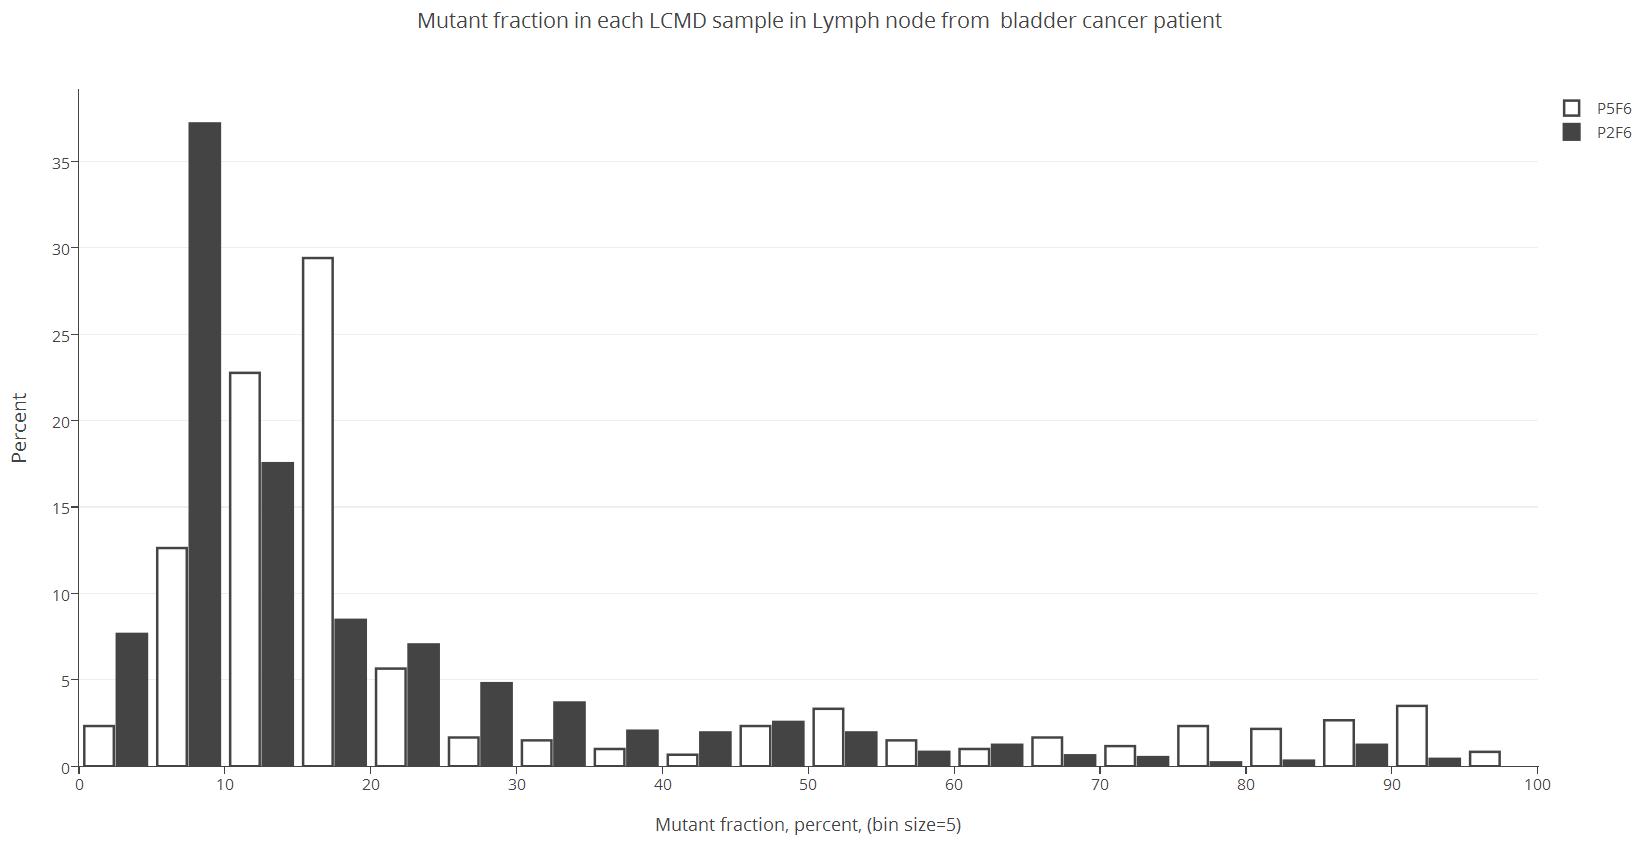
Descriptive statistics of mutant fraction found in each LCMD sample.
| P2F6 (M1) |
P5F6 (M2) | |
| N | 985 | 610 |
| Min (%) | 0 | 0 |
| Max (%) | 100 | 100 |
| Mean (%) | 18.6 | 29.3 |
| First Quantile (%) | 7.3 | 12.9 |
| Median (%) | 11.2 | 16.8 |
| Third Quantile (%) | 22.9 | 35.1 |
Links to 3 different approaches to visualizing the mutant fraction in the 3D volume.
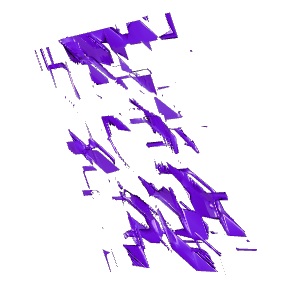
Isosurface of a random spread of homoplasmic cells (wild-type and/or mutant) in each LCMD volumes.
| P2F6 (M1) | Non-mutated | Mutated |
| P5F6 (M2) | Non-mutated | Mutated |
Isosurfaces of mutant fractions from 0% to 100% in 5% points increments.
Click on the picture to navigate to the page with all Isosurfaces for the two markers.
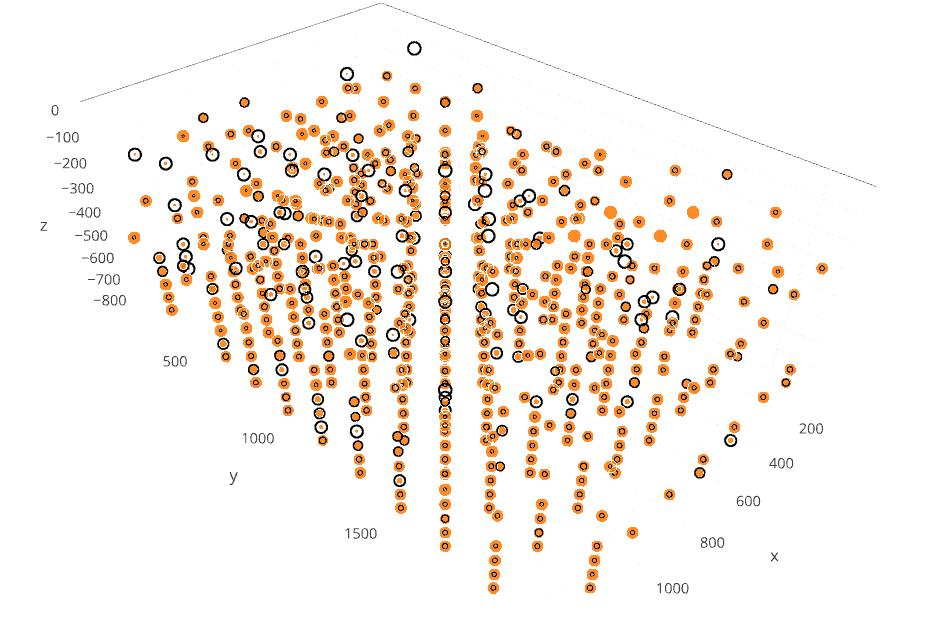
3D bubble plot of wild-type and mutant fractions.
Marker 1 (P2F6)
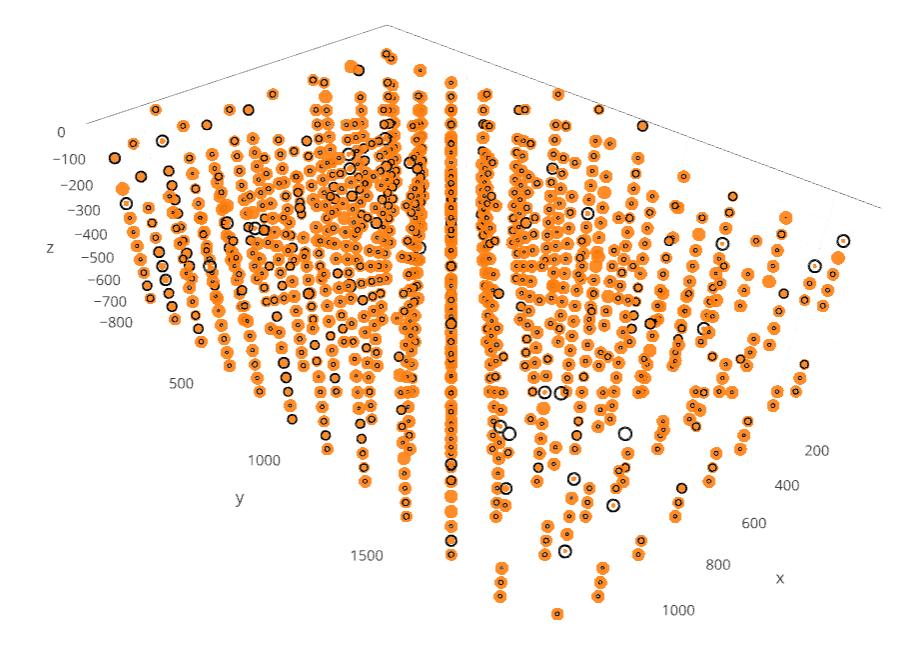
Marker 2 (P5F6)