Sample #13 Liver tumor (Hepatocellular carsinoma)

Overview (microtome cut in the middle of 66 consecutive cuts).
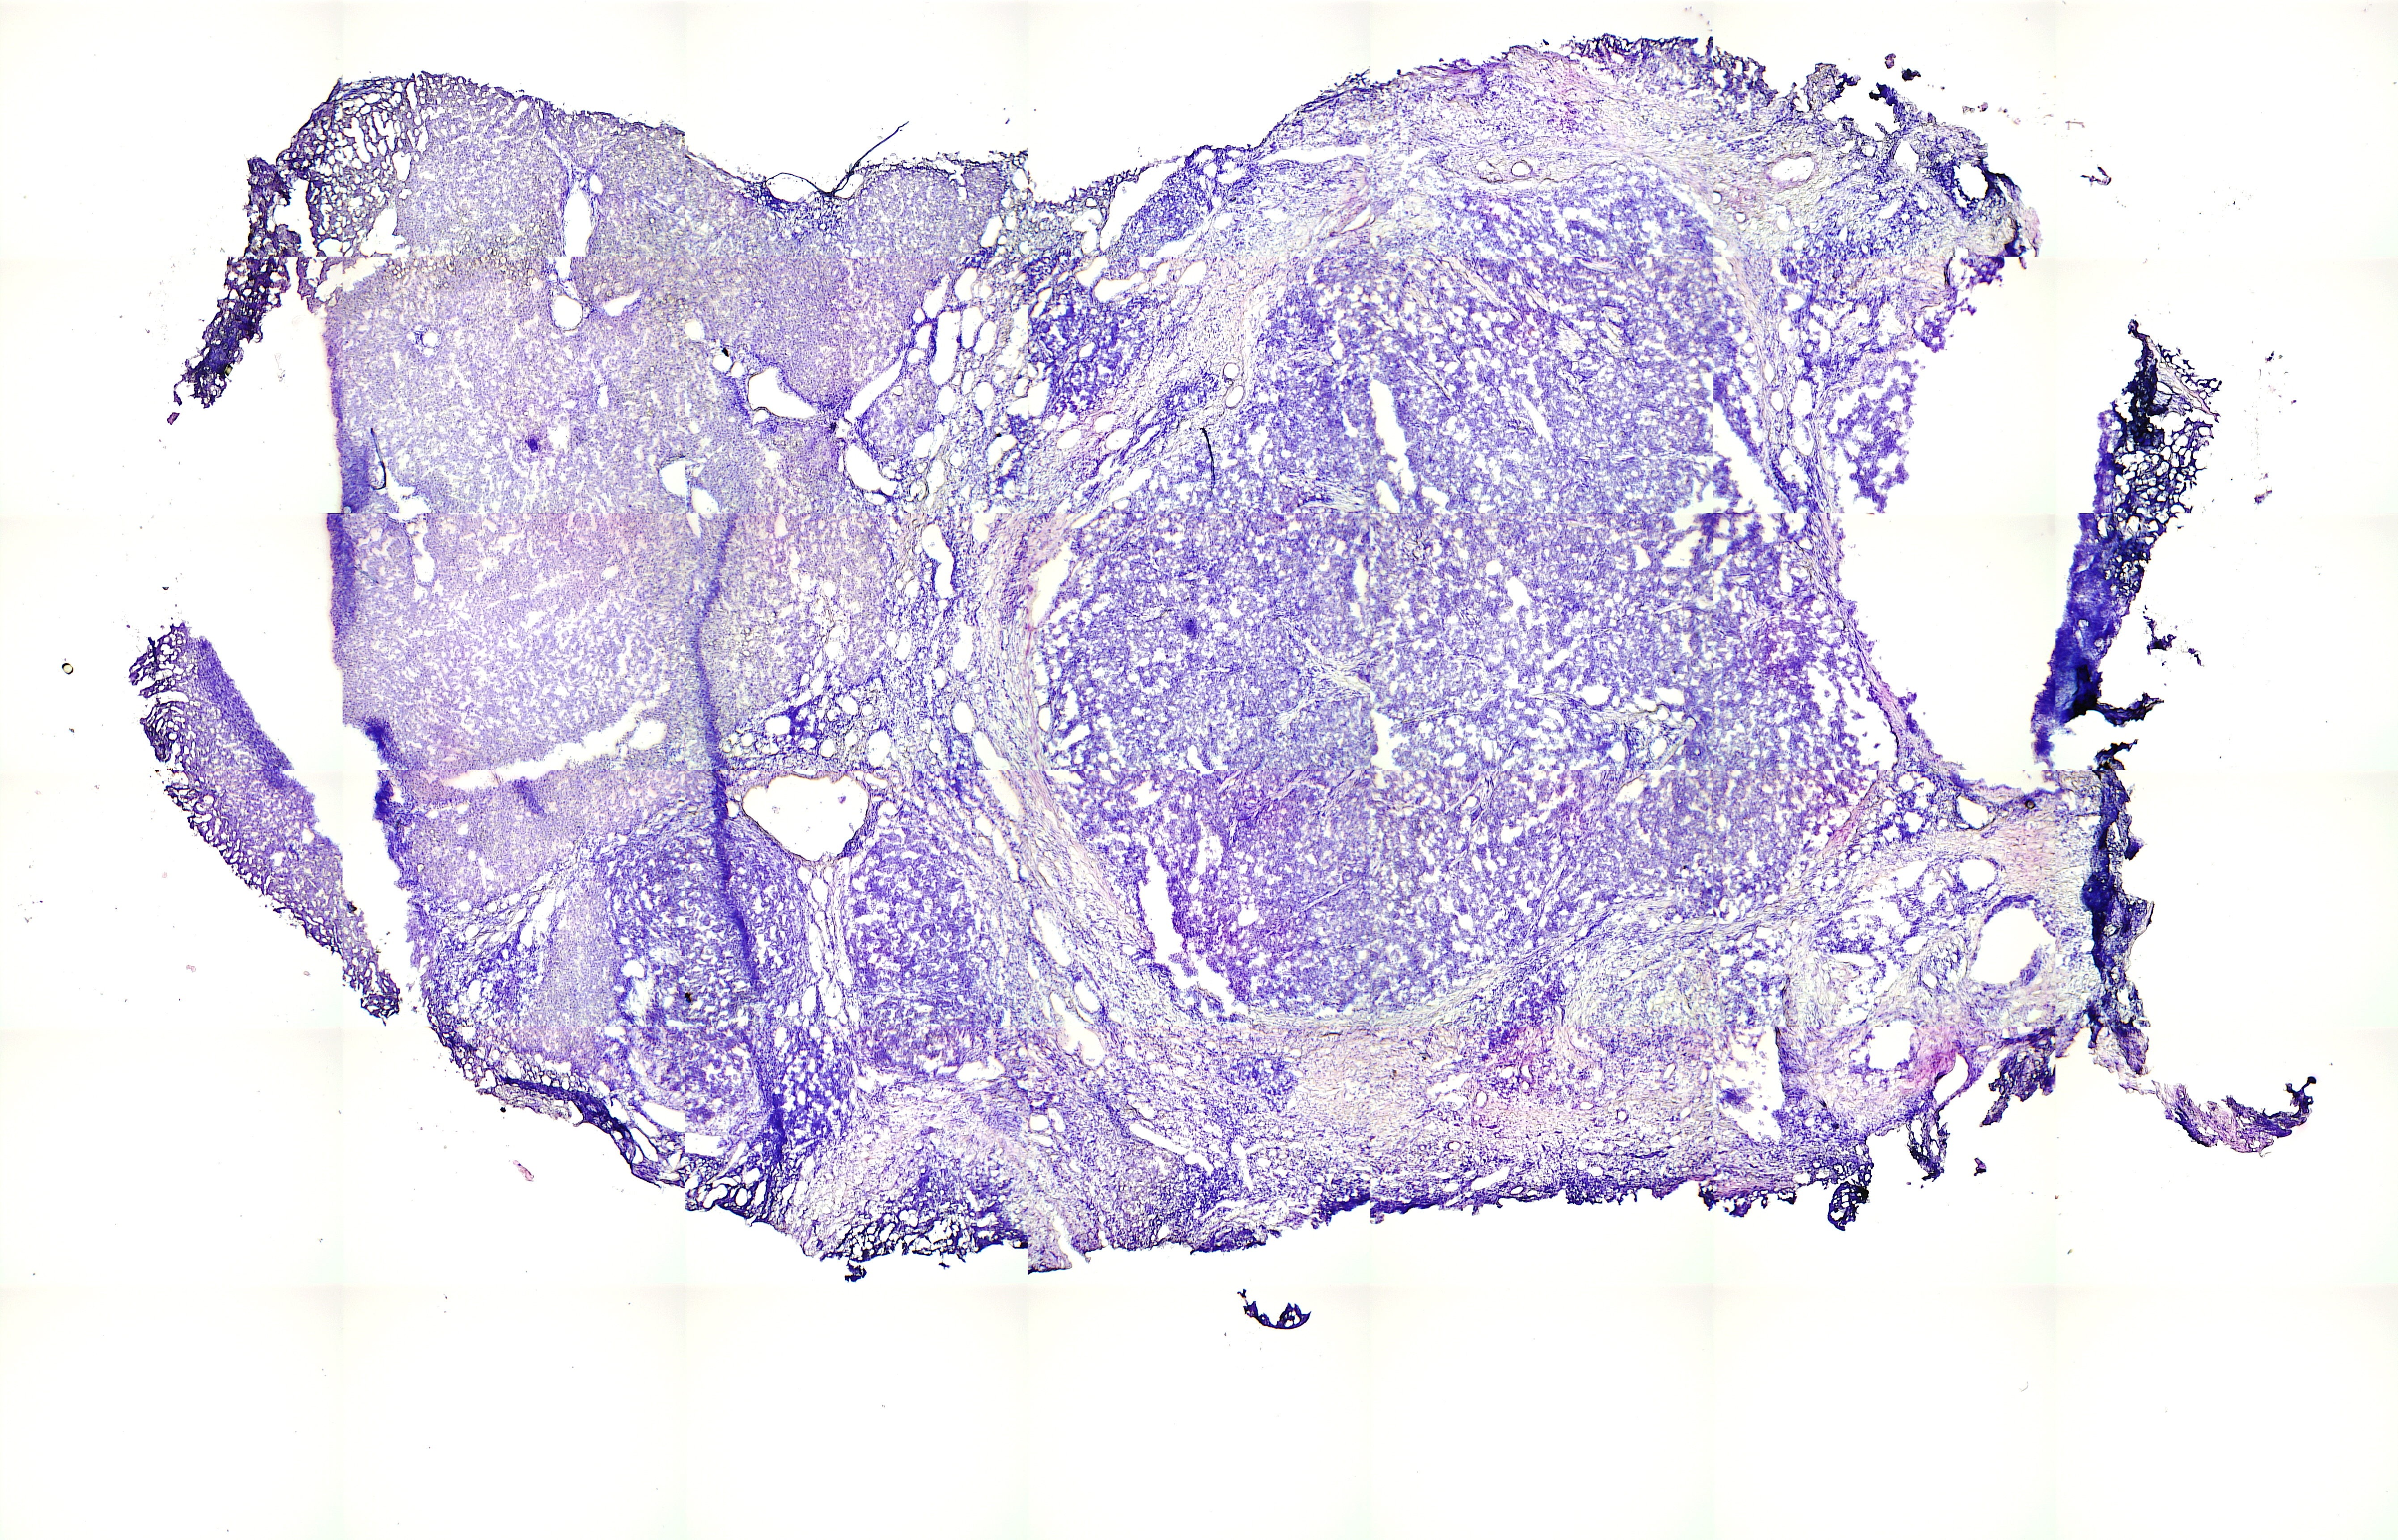 |
The sample was mounted and cut in a cryotome. 66 microtome slices, of 12 μm thickness were cut from the tissue. Every 5th cut was placed on membrane suitable for laser capture microdissection (LCMD), the 4 slices in between were placed on glass slides. A grid of 96 (~25000 μm2) circles was used as a template for the laser capture microdissection on each membrane slide. Pictures of slices and LCMD cuts can be found at the following link.
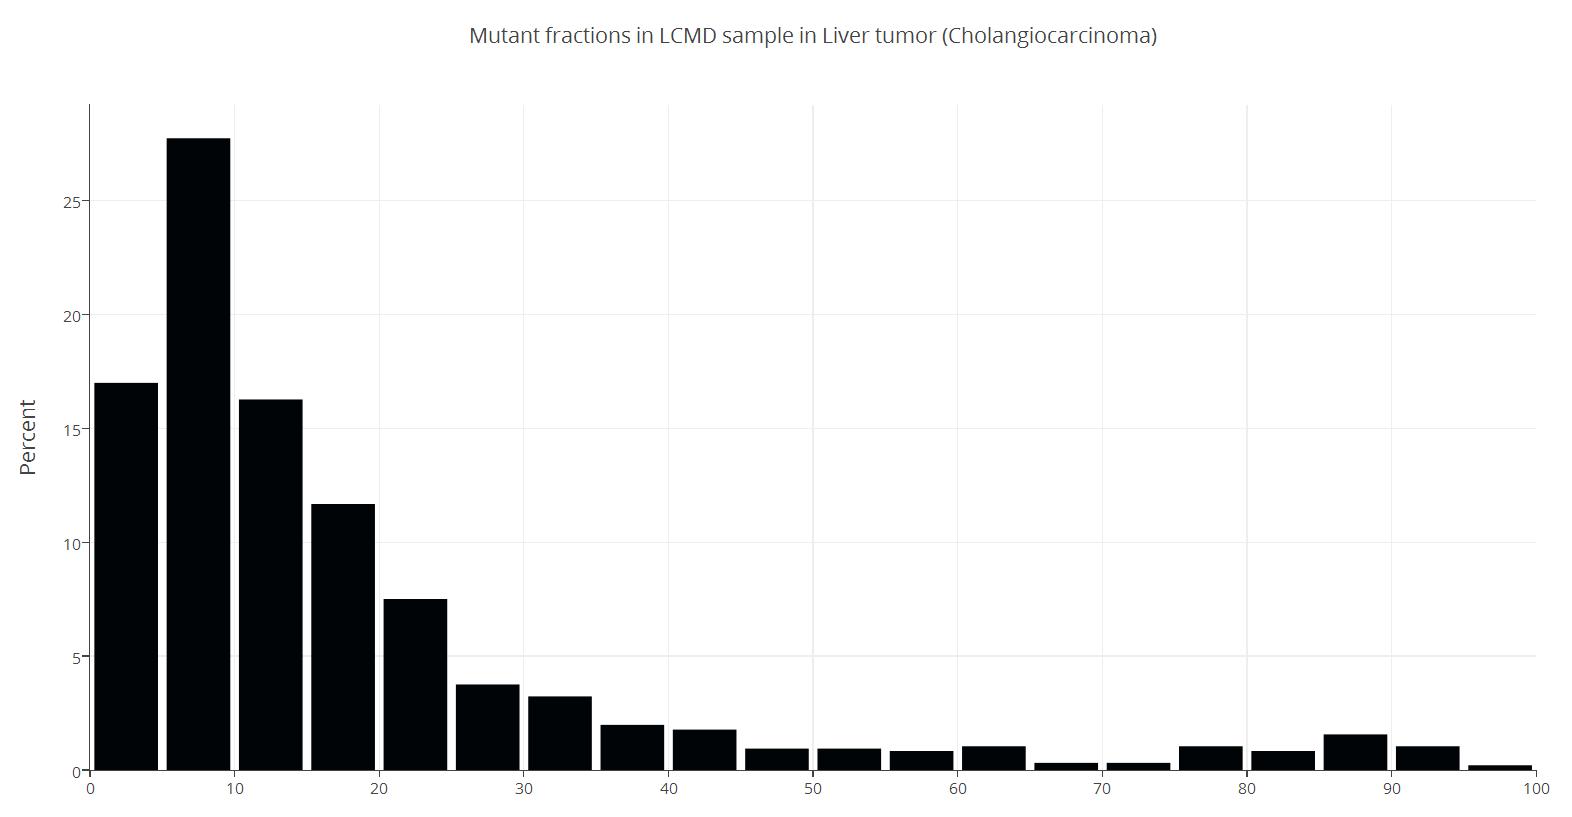
Descriptive statistics of mutant fraction found in each LCMD sample.
| Marker 1 | |
| N | 959 |
| Min (%) | 0 |
| Max (%) | 97 |
| Mean (%) | 18.5 |
| First Quantile (%) | 6.2 |
| Median (%) | 11.8 |
| Third Quantile (%) | 22.0 |
Links to 3 different approaches to visualizing the mutant fraction in the 3D volume.
Isosurfaces of a random spread of homoplasmic cells (wild-type and/or mutant) in each LCMD volumes.
| P1F15 | Non-mutated | Mutated |
Isosurfaces of mutant fractions from 5% to 95% in 5% point increments.
Each %-link will display a different 3D interaction figure.
| 35% | 70% | |
| 5% | 40% | 75% |
| 10% | 45% | 80% |
| 15% | 50% | 85% |
| 20% | 55% | 90% |
| 25% | 60% | 95% |
| 30% | 65% |
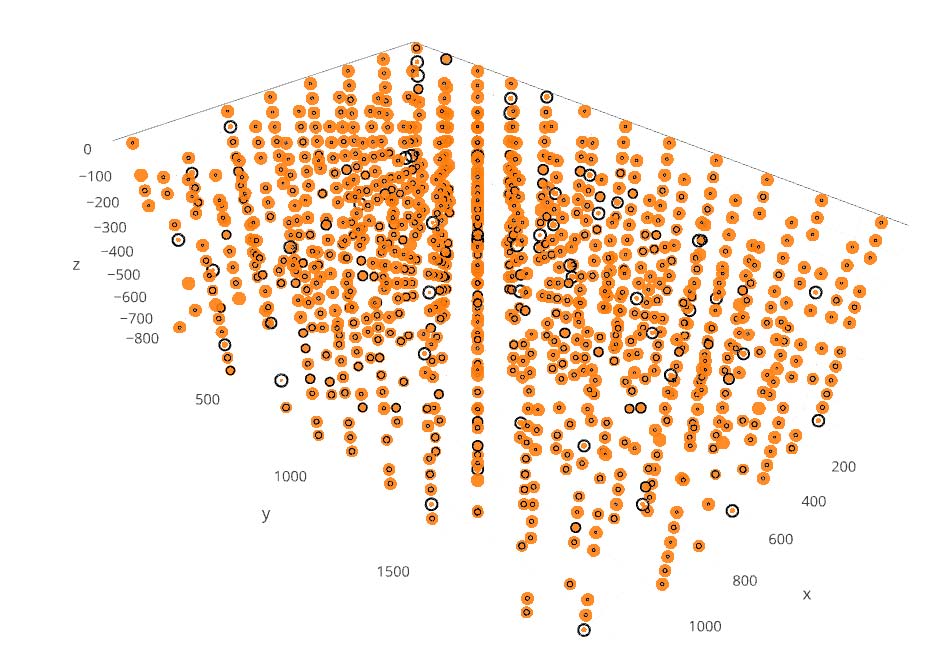
3D bubble plot of wild-type and mutant fractions.