
Integrated molecular analysis of miRNAs in breast cancer with clinical outcome
Project summary
microRNAs (miRNAs) are small, non-protein coding RNA molecules that function as negative regulators of gene expression either by inhibiting the translation of messenger RNAs (mRNAs) into protein or by degrading the mRNA. These molecules are relatively newly discovered, and much attention has been drawn towards these regulators the last years due to their role in various cellular processes, including cancer.

Figure 1. The canonical miRNA biogenesis pathway and miRNA function.
Some miRNAs are involved in tumorigenesis by directly modifying tumor suppressor or oncogenic pathways. For example the overexpression of miRNAs can inhibit tumor suppressor pathways, causing tumor initiation and progression. Conversely, the loss of miRNA expression through loss-of-function mutations could result in enhanced expression of oncogenes, also leading to cancer.

Figure 2. miRNAs may have oncogenic or tumor-suppressive roles in cancer. Upregulation of oncogenic miRNAs results in increased repression of tumor-suppressor target genes. Conversely, down-regulation of tumor-suppressor miRNAs results in decreased repression and thus increased expression of target oncogenes. Both scenarios may lead to cancer development and progression.
We are studying the role of miRNAs in breast cancer by integration of various levels of genomic data available, e.g. copy number and methylation data from the DNA level, and miRNA expression and mRNA expression of predicted target genes on the RNA level. By this integration we are characterizing the aberrations of miRNAs seen across breast cancer patients, aiming at a deeper understanding on the mechanisms behind miRNA aberrations and the consequences of this in patient phenotype and outcome.

Figure 3. Integration and analysis of multi-dimensional data. Biological components are measured across individuals and platforms, and their relations and interactions are identified. From this, complete networks and pathways are overlayed or built, and the emerging system is interrogated for alterations.
Main objective:
Integrate miRNA and other data from various platforms (CGH, methylation, expression, SNPs) to generate a comprehensive understanding of the influence from miRNA deregulation in susceptibility, aggressiveness and treatment response of breast cancer.
Aim:
Identify miRNAs that allow us to group patients based on miRNA expression profiles, and compare this to histopathological findings, clinical parameters and other “-omics” dataset from the same samples to suggests new individual or combined biomarkers for use as tools to personalize the treatment of breast cancer.
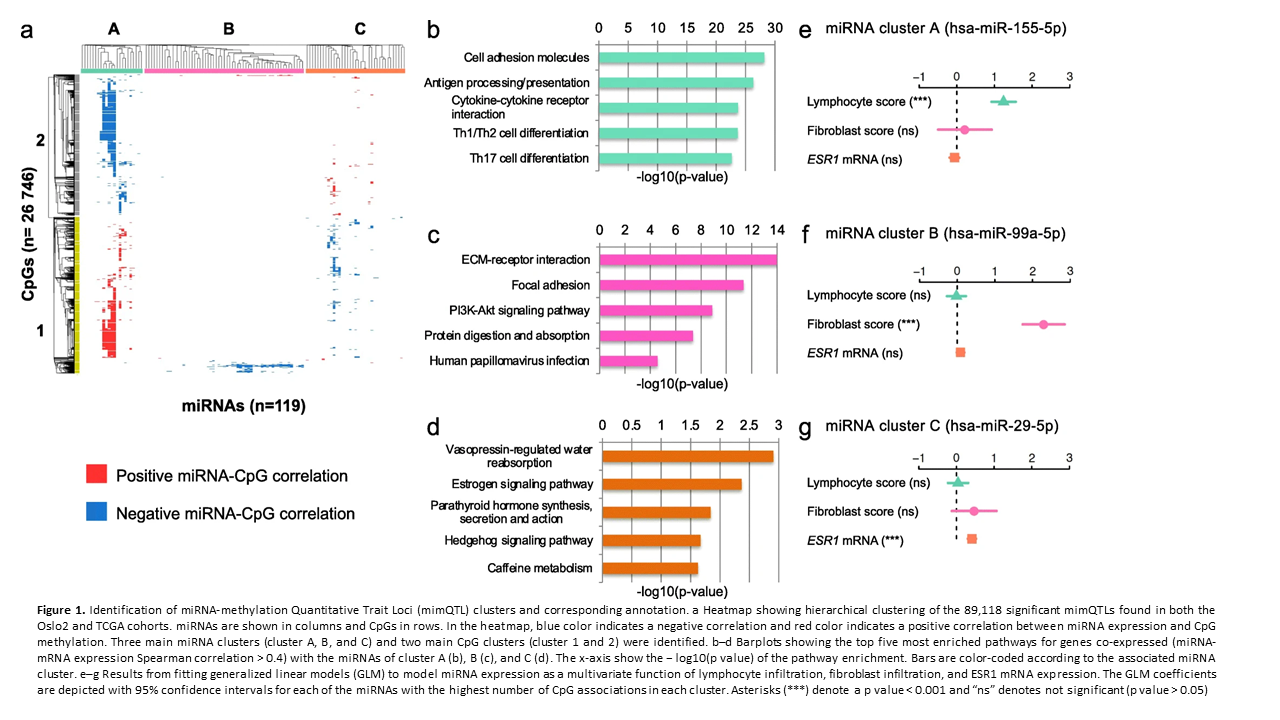
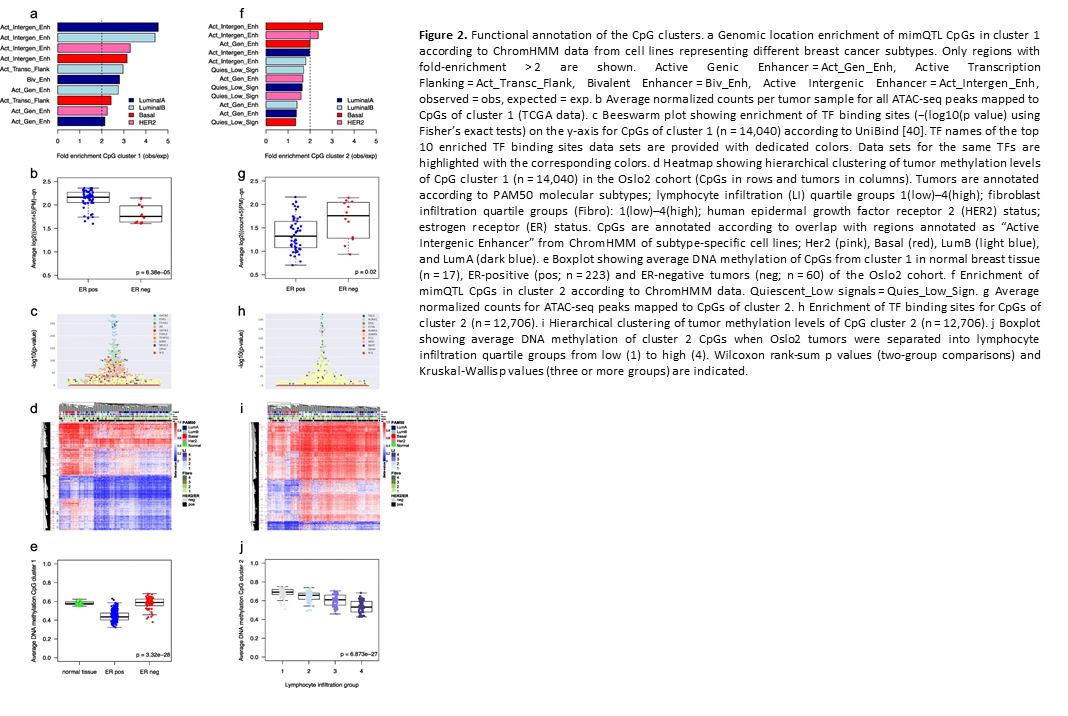
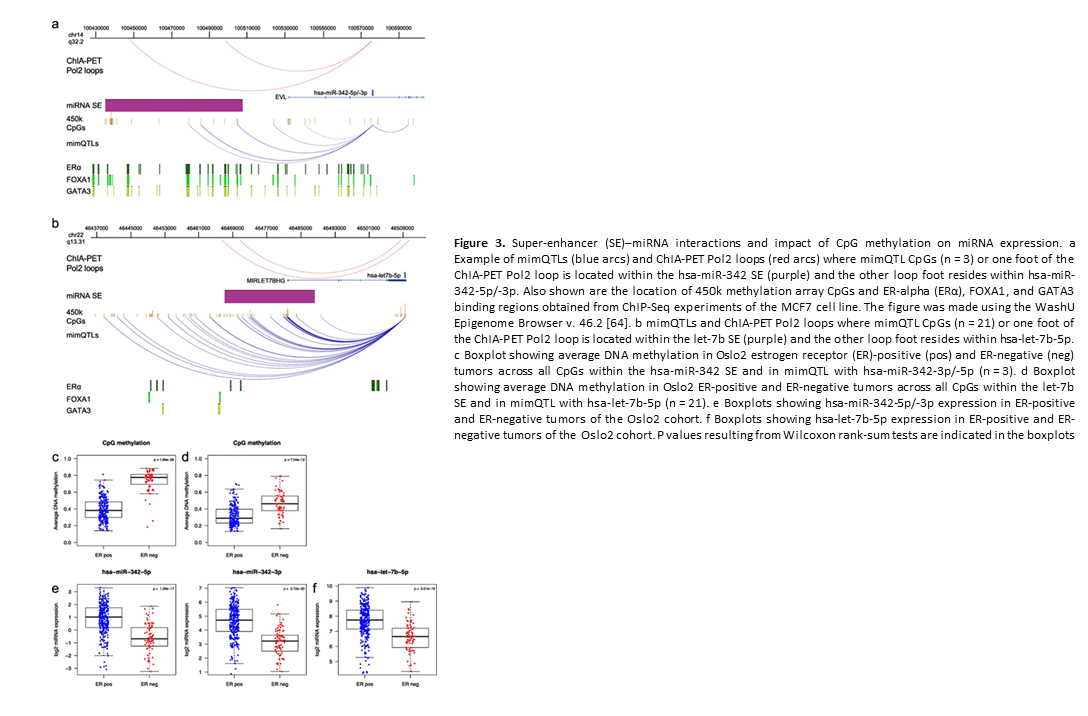
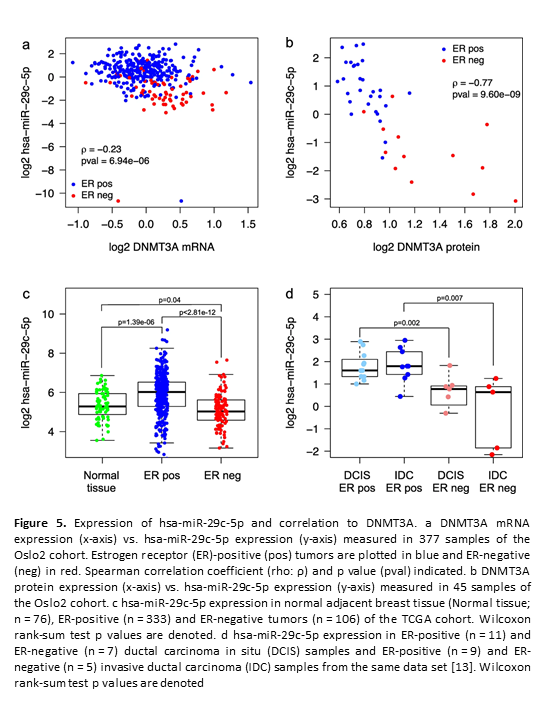
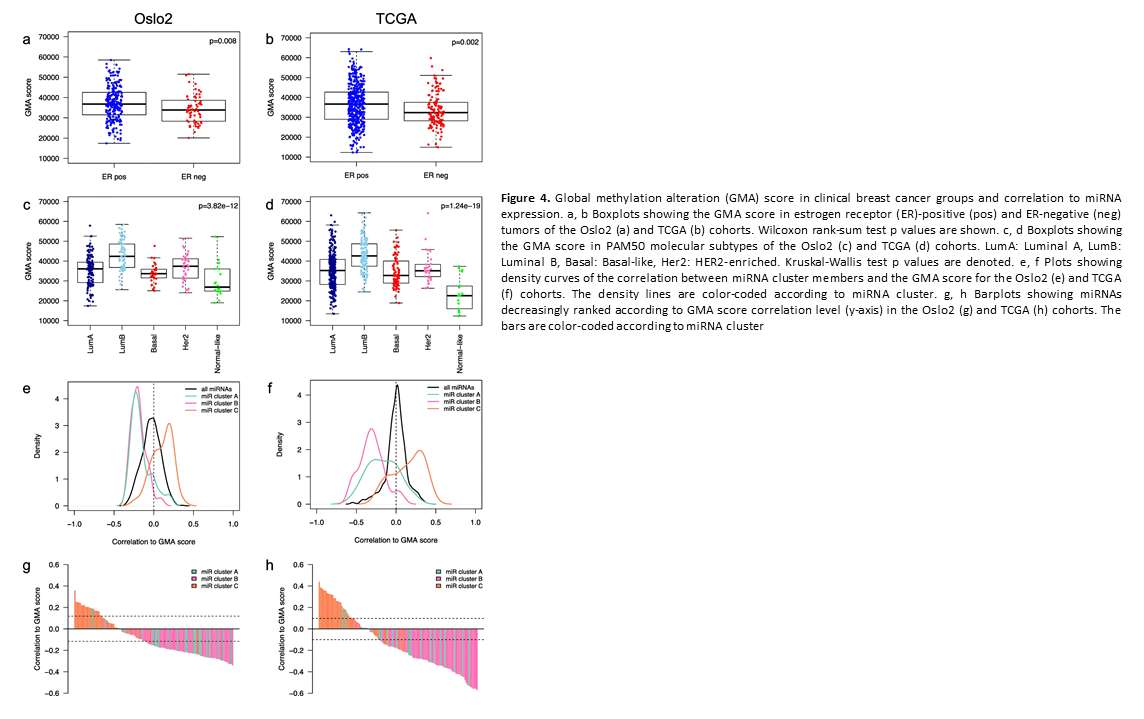
Crosstalk between microRNA expression and DNA methylation drives the hormone-dependent phenotype of breast cancer
Deregulation of cancer-related miRNAs is a common event in both benign and malignant
human breast tumors
Much research has focused on miRNAs that are deregulated in cancer, and less research has been done with benign tumors, although benign tumors are much more frequent in women than malignant ones. We have therefore analyzed the miRNA expression profiles in benign, (fibroadenoma/fibroadenomatosis), malignant and normal breast tissue using miRNA microarrays. We found out that benign tumors are more similar to malignant tumors than to normal tissue when considering the miRNA expression profiles (Figure 4).

Figure 4. Unsupervised correspondence analysis show the distribution of samples according to their total miRNA expression profiles in normal tissue (green), benign tumors (orange) and malignant tumors (red). The normal tissue is distinct from benign and malignant tumors, but the benign and malignant tumors are not clearly defined in separate groups. From Deregulation of cancer-related miRNAs is a common event in both benign and malignant human breast tumors. Carcinogenesis. 2014 Jan;35(1):76-85. doi: 10.1093/carcin/bgt333. PMID:24104550
Furthermore, we identified a set of 30 miRNAs that are considered as cancer-related miRNA, such as let-7 and miR-21, deregulated in the same way in benign tumors as in malignant tumors. In figure 6, the expression of only a few cancer-related miRNAs are shown. The miRNA expression in benign tumors is generally intermediate to normal and malignant tumors, indicating that miRNA expression is already deregulated at the early stages of tumor formation.

Figure 5. Cancer-related miRNA expression. miRNA expression of let 7, miR-145, miR-155 and miR 21 in normal tissue (green), benign tumors (orange), and malignant tumors (red). The expression of these cancer-related miRNAs have a similar deregulation in benign and malignant tumors, with the miRNA expression in benign tumors being intermediate to normal tissue and malignant tumors. All expressions are relative to the median expression in the normal tissue for each miRNA. From Deregulation of cancer-related miRNAs is a common event in both benign and malignant human breast tumors. Carcinogenesis. 2014 Jan;35(1):76-85. doi: 10.1093/carcin/bgt333. PMID:24104550
Integrated analysis of miRNA, copy number alterations and DNA methylation
 link in-cis miRNAs to other members of the same miRNA family.")
Figure 6. Genomic localization of the 70 in-cis miRNAs. The 70 in-cis miRNAs were identified using Wilcoxon rank-sum tests to identify differential miRNA expression between patients in different aberration groups. miRNAs are color coded according to main aberration type of the miRNA locus. The number in parentheses under aberration type represents the number of in-cis miRNAs in the given aberration category. Inter-chromosomal and intra-chromosomal lines (the latter is seen as independent lines on chromosomes 8 and 13) link in-cis miRNAs to other members of the same miRNA family. From Individual and combined effects of DNA methylation and copy number alterations on miRNA expression in breast tumors. Genome Biol. 2013 Nov 20;14(11):R126. doi: 10.1186/gb-2013-14-11-r126. PMID:24257477 PMCID:PMC4053776DOI:10.1186/gb-2013-14-11-r126

Figure 7. Examples of in-cis miRNAs. Six different miRNAs are depicted whose expression was associated with a certain aberration type in the breast cancer discovery cohort. The boxplots show the miRNA expression among aberration groups and the number in parentheses indicate the number of patients in a given aberration group. Hypomet, hypomethylation; hypermet, hypermethylation. From Individual and combined effects of DNA methylation and copy number alterations on miRNA expression in breast tumors. Genome Biol. 2013 Nov 20;14(11):R126. doi: 10.1186/gb-2013-14-11-r126. PMID:24257477 PMCID:PMC4053776DOI:10.1186/gb-2013-14-11-r126
 miR-148b-3p expression, (b) let-7e-3p expression. The P-values are from Wilcoxon rank-sum tests.")
Figure 8. miRNA expression in luminal and basal-like patients. miRNA expression when patients were divided into luminal and basal-like subgroups in the discovery and replication cohort. (a) miR-148b-3p expression, (b) let-7e-3p expression. The P-values are from Wilcoxon rank-sum tests. From Individual and combined effects of DNA methylation and copy number alterations on miRNA expression in breast tumors. Genome Biol. 2013 Nov 20;14(11):R126. doi: 10.1186/gb-2013-14-11-r126. PMID:24257477 PMCID:PMC4053776DOI:10.1186/gb-2013-14-11-r126
 and the ‘high’ group contains samples with expression above the median (n = 43). The P-value is from a log-rank test. The plot shows survival data of the discovery cohort.")
Figure 9. Kaplan-Meier curves showing relapse-free survival when dividing samples into high and low let-7e-3p expression groups. The ‘low’ group denotes samples with expression below the median (n = 43) and the ‘high’ group contains samples with expression above the median (n = 43). The P-value is from a log-rank test. The plot shows survival data of the discovery cohort. From Individual and combined effects of DNA methylation and copy number alterations on miRNA expression in breast tumors. Genome Biol. 2013 Nov 20;14(11):R126. doi: 10.1186/gb-2013-14-11-r126. PMID:24257477 PMCID:PMC4053776DOI:10.1186/gb-2013-14-11-r126
Integrated analysis of miRNA, mRNA and protein expression
![Figure 5. The miRNA-mRNA-protein interactome. The clustered heatmap represents all miRNA coefficients from the univariate model 3 with the 421 miRNAs shown as columns and the 105 gene/protein pairs shown as rows. Pearson correlation distance and complete linkage was used in the hierarchical clustering. The colors of the dendrograms represent the different clusters found by the PART algorithm [21]. The miRNAs form 23 unique clusters and the gene-protein pairs form four clusters. Genes/proteins residing in each cluster are indicated to the right in alphabetical order.](https://www.ous-research.no/kristensen/images/projects/miriam page ref 2 fig1.png "Figure 5. The miRNA-mRNA-protein interactome. The clustered heatmap represents all miRNA coefficients from the univariate model 3 with the 421 miRNAs shown as columns and the 105 gene/protein pairs shown as rows. Pearson correlation distance and complete linkage was used in the hierarchical clustering. The colors of the dendrograms represent the different clusters found by the PART algorithm [21]. The miRNAs form 23 unique clusters and the gene-protein pairs form four clusters. Genes/proteins residing in each cluster are indicated to the right in alphabetical order.")
Figure 10. The miRNA-mRNA-protein interactome. The clustered heatmap represents all miRNA coefficients from the univariate model 3 with the 421 miRNAs shown as columns and the 105 gene/protein pairs shown as rows. Pearson correlation distance and complete linkage was used in the hierarchical clustering. The colors of the dendrograms represent the different clusters found by the PART algorithm [21]. The miRNAs form 23 unique clusters and the gene-protein pairs form four clusters. Genes/proteins residing in each cluster are indicated to the right in alphabetical order. From Integrated analysis reveals microRNA networks coordinately expressed with key proteins in breast cancer. Genome Med. 2015Feb 2;7(1):21. doi: 10.1186/s13073-015-0135-5. eCollection 2015. PMID:25873999 PMCID:PMC4396592DOI:10.1186/s13073-015-0135-5
, histological grade, human epidermal growth factor receptor 2 (HER2) status, and estrogen receptor (ER) status. The colors in the heatmap represent the patient-specific effects of miRNA on protein and are numerical values obtained by multiplying each miRNA coefficient (from the multivariate analysis) with the corresponding miRNA expression, in a given patient, for a given protein. The clustering of the proteins and patients was performed using Euclidean distance and complete linkage. Na, not available.")
Figure 11. Patient-specific predicted effects of miRNA on protein. Rows represent the 105 genes/proteins and columns represent the 283 patients. The color bars under the dendrogram represent PAM50 and RPPA molecular subtypes (mRNA and protein based, respectively), histological grade, human epidermal growth factor receptor 2 (HER2) status, and estrogen receptor (ER) status. The colors in the heatmap represent the patient-specific effects of miRNA on protein and are numerical values obtained by multiplying each miRNA coefficient (from the multivariate analysis) with the corresponding miRNA expression, in a given patient, for a given protein. The clustering of the proteins and patients was performed using Euclidean distance and complete linkage. Na, not available. From Integrated analysis reveals microRNA networks coordinately expressed with key proteins in breast cancer. Genome Med. 2015Feb 2;7(1):21. doi: 10.1186/s13073-015-0135-5. eCollection 2015. PMID:25873999 PMCID:PMC4396592DOI:10.1186/s13073-015-0135-5
 The effect of mRNA on protein for all significant mRNA coefficients (‘gamma’). (B) Volcano plot showing all estimated mRNA coefficients (‘gamma’) plotted against corresponding P-values. Significant and negative associations are shown in blue and significant and positive associations are shown in red. (C) The effect of miRNA on protein for all significant miRNA coefficients (‘beta’). (D) Volcano plot showing all estimated miRNA coefficients (‘beta’) plotted against corresponding P-values. Coloring as in (B). (E) Number of miRNAs per protein. The horizontal axis represents the negative and positive number of associations with miRNAs, and the vertical axis represents the 105 proteins in descending order. (F) Number of proteins per miRNA. The horizontal axis represents the negative and positive number of associations with proteins, and the vertical axis represents the 421 miRNAs in descending order. (G) Example of a negative association between miRNA expression and protein expression. The horizontal axis represents BRAF mRNA expression and the vertical axis B-Raf protein expression (both on log2-scale). Each point represents a patient, and the color indicates whether the expression of miR-638 is above the median (red) or below the median (black). Solid lines represent smoothing splines fitted to the data. The dotted line represents a linear regression fit to the data. For any fixed level of mRNA expression, high expression of miR-638 is associated with decreased protein expression of B-Raf. (H) Example of a positive association between miRNA expression and protein expression. The horizontal and vertical axes are the same as in (G), but here each patient point is color-coded according to miR-107 expression (red, miR-107 expression above median; black, miR-107 expression below median). For any fixed level of mRNA expression, high expression of miR-107 is associated with increased B-Raf protein expression.")
Figure 12. Effect of mRNA and miRNA on protein expression. (A) The effect of mRNA on protein for all significant mRNA coefficients (‘gamma’). (B) Volcano plot showing all estimated mRNA coefficients (‘gamma’) plotted against corresponding P-values. Significant and negative associations are shown in blue and significant and positive associations are shown in red. (C) The effect of miRNA on protein for all significant miRNA coefficients (‘beta’). (D) Volcano plot showing all estimated miRNA coefficients (‘beta’) plotted against corresponding P-values. Coloring as in (B). (E) Number of miRNAs per protein. The horizontal axis represents the negative and positive number of associations with miRNAs, and the vertical axis represents the 105 proteins in descending order. (F) Number of proteins per miRNA. The horizontal axis represents the negative and positive number of associations with proteins, and the vertical axis represents the 421 miRNAs in descending order. (G) Example of a negative association between miRNA expression and protein expression. The horizontal axis represents BRAF mRNA expression and the vertical axis B-Raf protein expression (both on log2-scale). Each point represents a patient, and the color indicates whether the expression of miR-638 is above the median (red) or below the median (black). Solid lines represent smoothing splines fitted to the data. The dotted line represents a linear regression fit to the data. For any fixed level of mRNA expression, high expression of miR-638 is associated with decreased protein expression of B-Raf. (H) Example of a positive association between miRNA expression and protein expression. The horizontal and vertical axes are the same as in (G), but here each patient point is color-coded according to miR-107 expression (red, miR-107 expression above median; black, miR-107 expression below median). For any fixed level of mRNA expression, high expression of miR-107 is associated with increased B-Raf protein expression. From Integrated analysis reveals microRNA networks coordinately expressed with key proteins in breast cancer. Genome Med. 2015Feb 2;7(1):21. doi: 10.1186/s13073-015-0135-5. eCollection 2015. PMID:25873999 PMCID:PMC4396592DOI:10.1186/s13073-015-0135-5
Project members: Miriam Ragle Aure , Andliena Tahiri, Jovana Klajic, Grethe I. Grenaker Alnæs
PhD thesis from project:
1. Miriam Aure 27.11.2013; Title of the thesis: From DNA to RNA to protein:Integrated analysis of high-throughput molecular data from primary breast carcinomas.
2. Andliena Tahiri 03.03.2016; Title of the thesis: Regulatory and functional genomic biomarkers in breast cancer and melanoma.
External colaborators:
- Zohar Yakhini, Technion, Israel http://bioinfo.cs.technion.ac.il/people/zohar/
- Sampsa Hautaniemi, Biomedicum, University of Helsinki, Finland, http://research.med.helsinki.fi/gsb/hautaniemi/
- Anthony Mathelier, NCMM, Oslo https://mathelierlab.com/
Recent publications:
1.Integrated analysis reveals microRNA networks coordinately expressed with key proteins in breast cancer.
Genome Med. 2015Feb 2;7(1):21. doi: 10.1186/s13073-015-0135-5. eCollection 2015. PMID:25873999 PMCID:PMC4396592DOI:10.1186/s13073-015-0135-5
2. Deregulation of cancer-related miRNAs is a common event in both benign and malignant human breast tumors.
Carcinogenesis. 2014 Jan;35(1):76-85. doi: 10.1093/carcin/bgt333. PMID:24104550
3. Individual and combined effects of DNA methylation and copy number alterations on miRNA expression in breast tumors.
Genome Biol. 2013 Nov 20;14(11):R126. doi: 10.1186/gb-2013-14-11-r126. PMID:24257477 PMCID:PMC4053776DOI:10.1186/gb-2013-14-11-r126
4. Crosstalk between microRNA expression and DNA methylation drives the hormone-dependent phenotype of breast cancer. Genome Medicine volume 13, Article number: 72 (2021) https://pubmed.ncbi.nlm.nih.gov/33926515/