
Genomic instability and next generation sequencing
Single cell DNA sequencing and sequencing the non-canonical genomes
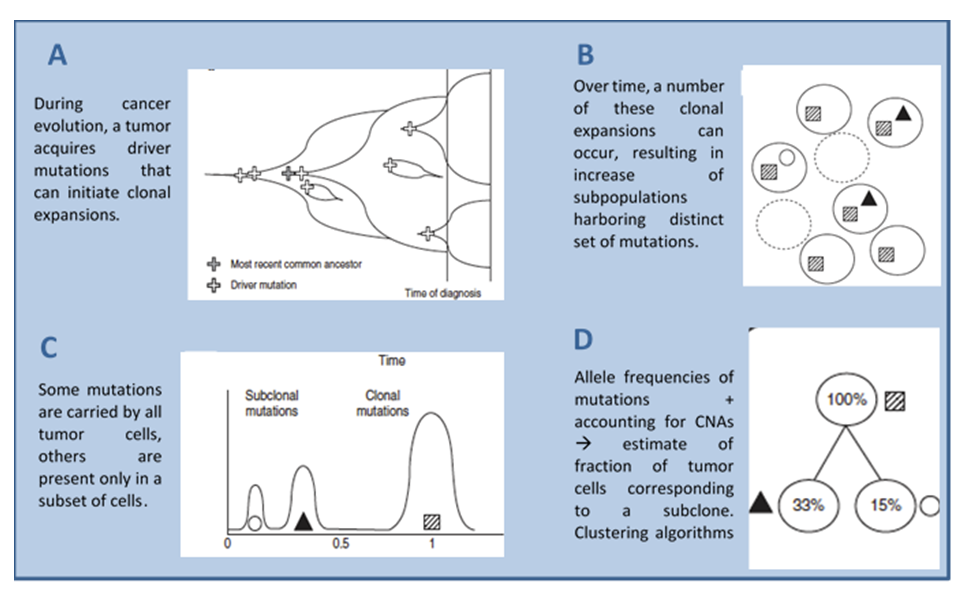
Single cell DNA sequencing reveal the heterogeneous nature of human tissue and the subclonal content of a tumor (figure 1). Our aim is to further elucidate this heterogeneity in a targeted manner. The MissionBio Tapestri platform is a Single-cell multi-omics platform able to simultaneously detect single nucleotide variants (SNVs), copy number aberrations (CNAs) and indels from the same cell. Ready panels for several malignancies are available as well as custom panels up to 700 amplicons (amplicon length 175 – 275 bp). This technology enables a sensitive detection of cell types and specifically determine co-occuring variants. A streamlined bioinformatics pipeline facilitate robust analysis and visualization of therapy response, resistance and relapse as well as disease development.
Genomic instability is a hallmark of malignant tumours, causing disturbed integrity of the genome, numerical alterations, and structural changes. For various cancer types genomic instability has been associated with poor prognosis, suggesting that genomic instability may confer growth advantage of cancer cells. In most cancer types, genomic instability is characterized by copy number alterations, allelic imbalance, or the loss of heterozygosity.
The molecular basis of genomic instability remains still unclear; however, mutations in key checkpoint proteins and DNA repair genes are supposed to be involved. Interestingly, the effects of disordered genomic organization may also have an unfavourable effect on the overall viability and fitness of cancer cells. Precise delineation of the negative and positive effects of genomic instability on cancer cells is of potentially great importance for tumour classification, survival prediction, and individualized therapy.
Our research is focused on the assessment of genomic instability in a variety of tumour types by applying various methods or the developing novel algorithms. This work includes projects about the complexity and genomic aberrations in breast tumors and serous ovarian cancers; integrated omics analysis; efficient algorithms for single- and multi-track copy number segmentation analysis; genomic architecture; comparison of platforms and algorithms for classification of copy number alterations in human breast tumors.
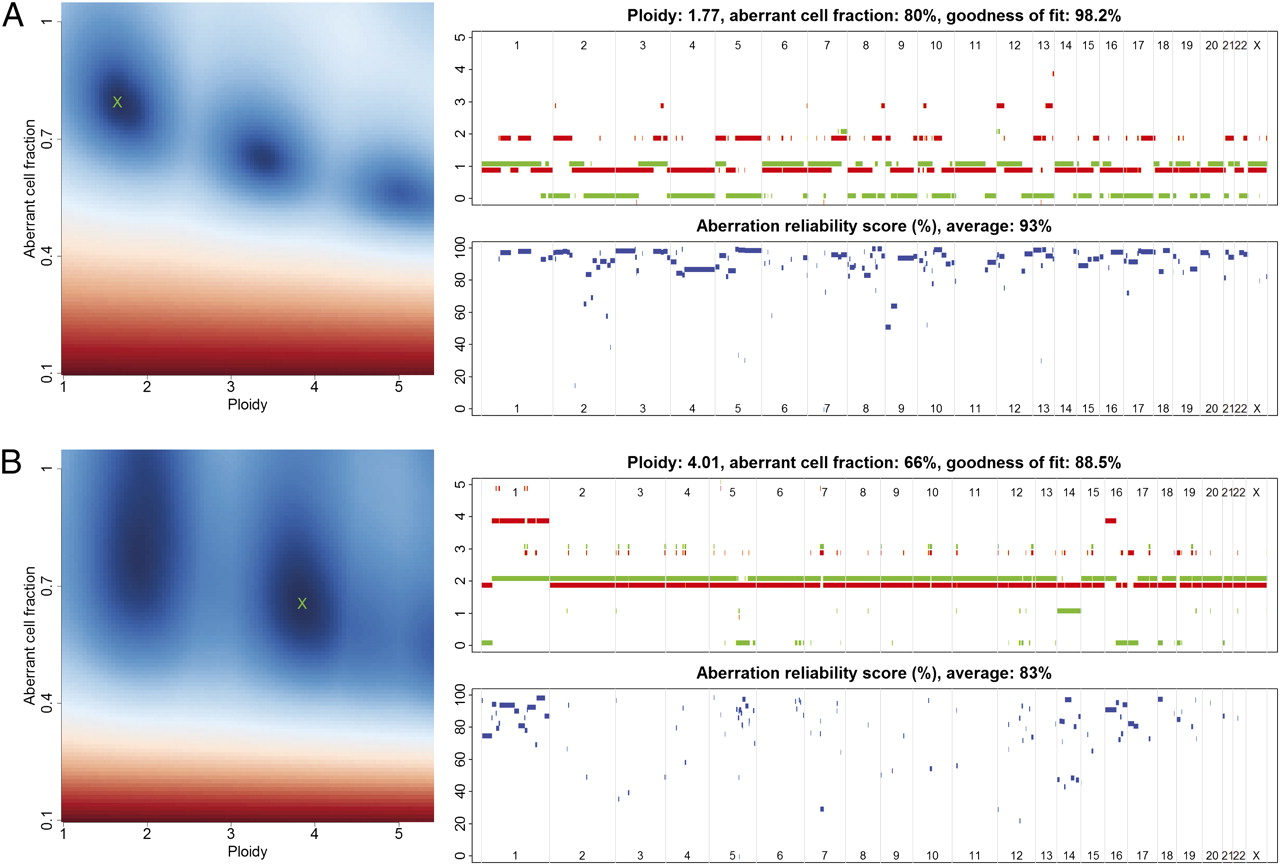
Figure 1.ASCAT profiles and their calculation. Two examples are given: (A) a tumor with ploidy close to 2n and (B) a tumor with ploidy close to 4n. (Left) ASCAT first determines the ploidy of the tumor cells ψt and the fraction of aberrant cells ρ. This procedure evaluates the goodness of fit for a grid of possible values for both parameters (blue, good solution; red, bad solution. On the basis of this goodness of fit, the optimal solution is selected (green cross). Using the resulting tumor ploidy and aberrant cell fraction, an ASCAT profile is calculated (Upper Right), containing the allele-specific copy number of all assayed loci [copy number on the y axis vs. the genomic location on the x axis; green, allele with lowest copy number; red, allele with highest copy number; for illustrative purposes only, both lines are slightly shifted (red, down; green, up) such that they do not overlap; only probes heterozygous in the germline are shown]. Finally, for all aberrations found, an aberration reliability score is calculated (Lower Right). From Allele-specific copy number analysis of tumors. Proc Natl Acad Sci U S A. 2010 Sep 28;107(39):16910-5. doi: 10.1073/pnas.1009843107. Epub 2010 Sep 13.PMID:20837533 PMCID:PMC2947907DOI:10.1073/pnas.1009843107
What are the common abberations in four types of female cancer?

Figure 2. GISTIC focal peaks for overlapping regions of CBS- and PCF-segmented data in four different female cancers. Circos-plot of GISTIC copy number alteration data obtained from female patients with breast (B), ovarian (O), endometrial (E), or cervical (C) cancers. The breast (pink), ovarian (green), endometrial (purple), and cervical (brown) cancers are presented in a clockwise direction. For each cohort, from the top of circle, chromosomes 1 – 23 are displayed and each chromosome’s cytoband is colored differently. Aberrations are represented by lines linking the overlapping cytobands between different cancers. The width of the lines is matched to the cytobands. Amplification lines are colored in red and deletion lines are marked in blue. Panel B demonstrates similarities and divergences between the four investigated female cancers for at least two genomic regions identified by the CBS and PCF algorithms. On the left side, copy number gains of GISTIC focal peaks are presented and on the right side are copy number loss of GISTIC focal peaks illustrated, for both, CBS- and PCF-segmented data. The number of peaks obtained by GISTIC, for breast, ovarian, endometrial, and cervical cancer that are colored in pink, green, purple, and brown, respectively. From A systematic comparison of copy number alterations in four types of female cancer. BMC Cancer. 2016 Nov 22;16(1):913. PMID:27876019
How we can trace the origin of disseminated tumor cells (DTCs) in breast cancer?

Figure 3. DNA copy number profiles of breast tumors and bone marrow-derived single cells. a–g Per patient profiles are shown as concentric circles inside the circular human karyogram. Total (clonal) copy number is represented as a heat map from blue to red as indicated. Tumor samples and single cells are labeled on the corresponding circles and are color-coded: primary tumor bulk (PT) in cyan, lymph node bulk (LN) in purple, DTCs in orange, aberrant cells of unknown origin in dark green, and normal cells in green. Cells isolated after MOPC 21 isotype control staining are boxed. Panels are shown for patient MicMa003 (a), MicMa017 (b), MicMa019 (c), MicMa044 (d), MicMa083 (e), and MicMa107 at the time of diagnosis (f) and 3 years post-diagnosis (g). From Tracing the origin of disseminated tumor cells in breast cancer using single-cell sequencing. Genome Biol. 2016 Dec 9;PMID:27931250 PMCID:PMC5146893DOI:10.1186/s13059-016-1109-7

Figure 4. Tracing the origins of DTCs in the breast cancer phylogenetic trees. Copy number-based phylogenetic trees drawn up for patients MicMa003 (a), MicMa083 (b), and MicMa107 (c). Nodes in the trees correspond to (sub)clones and are color-coded based on their type as indicated (primary or lymph node, DTC, AU, or normal cell). Grey nodes are not observed directly but can be inferred from the data. Nodes are annotated with their specific CNA event and, where possible, with their estimated cancer cell fraction (the percentage of tumor cells containing the indicated aberration). Within the tumors, branch lengths reflect differences in cancer cell fraction. The most recent common ancestor (MRCA) in each bulk sample is indicated with a thicker stroke. For MicMa107, single cells isolated 3 years post-diagnosis are represented as striped nodes. DTC 107M has undergone a whole-genome duplication (WGD). From Tracing the origin of disseminated tumor cells in breast cancer using single-cell sequencing. Genome Biol. 2016 Dec 9;PMID:27931250 PMCID:PMC5146893DOI:10.1186/s13059-016-1109-7

Figure 5. Copy-number changes were analyzed from sequencing data from the DTC003 and SNP-CGH data from the corresponding primary tumors, MicMa003 and MicMa083. From.Next-generation sequencing of disseminated tumor cells. Front Oncol. 2013 Dec 31;3:320. doi: 10.3389/fonc.2013.00320. PMID:24427740
Members: Grethe Irene Grenaker
PhD thesis from project:
1. Fatemeh Kaveh 10.10.2013; Title of the thesis: Genomic signatures in progression of breast cancer with reference to gynecological carcinomas.
2. Ellen Møller 09.03.2015; Title of the thesis: Genomic alterations and heterogeneity in progression of breast carcinomas.
External colaborators:
- Kevin White, University od Chicago, USA http://ime.uchicago.edu/people/fellows/kevin_white/
- Peter van Loo, Crick Institute, London, UK https://www.crick.ac.uk/peter-van-loo
- David Wedge, Oxford University, UK https://www.bdi.ox.ac.uk/team/david-wedge
- Thierry Voet, Leuven University, Belgium and Sanger Institute, http://www.sanger.ac.uk/people/directory/voet-thierry
- Charles Vaske, Nantomics, LA, USA http://five3genomics.com/team/charles-vaske
Recent publications:
1. Tracing the origin of disseminated tumor cells in breast cancer using single-cell sequencing.
Genome Biol. 2016 Dec 9;PMID:27931250 PMCID:PMC5146893DOI:10.1186/s13059-016-1109-7
2. A systematic comparison of copy number alterations in four types of female cancer.
BMC Cancer. 2016 Nov 22;16(1):913. PMID:27876019
3.Next-generation sequencing of disseminated tumor cells.
Front Oncol. 2013 Dec 31;3:320. doi: 10.3389/fonc.2013.00320. PMID:24427740
4. Allele-specific copy number analysis of tumors.
Proc Natl Acad Sci U S A. 2010 Sep 28;107(39):16910-5. doi: 10.1073/pnas.1009843107. Epub 2010 Sep 13.PMID:20837533 PMCID:PMC2947907DOI:10.1073/pnas.1009843107