
Epigenetic alterations to predict and explain response to treatment
We have previously shown that DNA methylation linked to proliferation is altered both during treatment and between responders and non-responders [Klajic et al., CCR 2014]. Treatment with the anti-angiogenic drug bevacizumab in addition to chemotherapy has shown efficacy for breast cancer in some clinical trials, but better biomarkers are needed to (optimally) select patients for treatment. The aim of this study is to use DNA methylation in a multiomic approach to predict response to treatment, as well as to understand the molecular alterations associated with good or poor response.
Using a machine learning approach (LASSO with leave-one-out cross-validation) we train the prediction model on all samples except one, then we apply the model on the left-out sample. When doing this for all samples (patients) we observe a very good prediction performance for response to the combination therapy of chemo and bevacizumab(AUC=0.87; Figure 1A).
In Figure 1B we see examples of differences in methylation in the pre-treated samples, showing that there are biolgically meaningful differences in methylation.
This observation is also validated in an independent patient cohort (PROMIX).
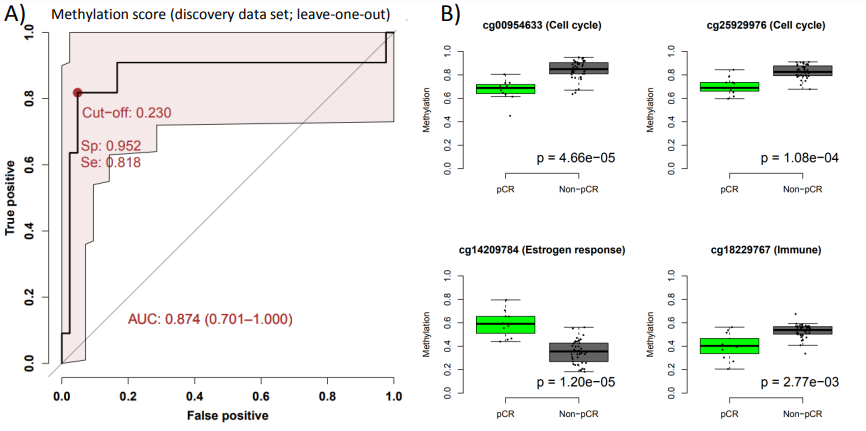
Figure 1: Identification of predictive signatures for response to neoadjuvant treatment with chemotherapy plus bevacizumab in ER positive breast cancer. A) ROC curve showing specificity vs sensitivity for the leave-one-out cross-validation probabilities for response. B) Boxplots of DNA methylation levels in pre-treated samples for example CpGs in the identified predictive signature. P-value is determined using t-test.
Using the emQTL approach on delta methylation and delta expression (i.e. difference before and after treatment), we identified two biclusters of CpGs and genes (Figure 2A). Genes in Bicluster 1 were enriched in genes related to cell cycle, metabolism and chromosomal organization (Figure 2B), and CpGs were enriched in enhancers (Figure 2C). Interestingly, the CpGs were clearly enriched in binding sites of the transcription factor (TF) GRHL2 (Figure 2D), which is known to play a role both proliferation and epithelial to mesenchymal transition (EMT), and the CpG-gene pairs were enriched in chromatin loops (Figure 2E).
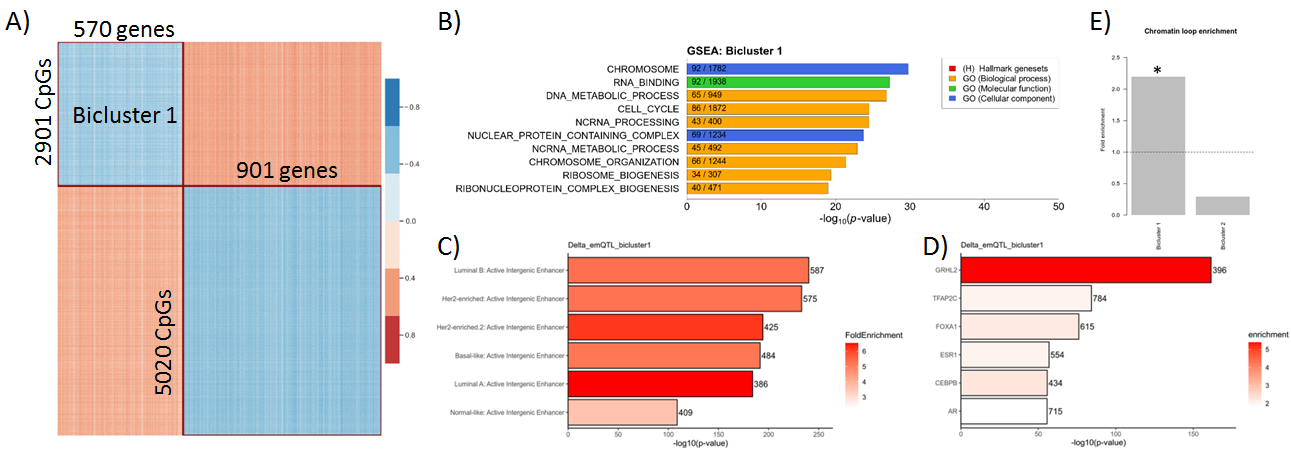
Figure 2: A) Biclustering of correlation coefficients between DNA methylation and gene expression identfies two biclusters. Gene set enrichment analysis (B), chromatin state enrichment analysis (C), TF binding enrichment (D) and chromatin loop enrichment (E) of CpGs and genes in Bicluster 1.
Investigating the delta methylation levels (difference before and after treatment) we observe that tumors either gain or lose methylation during the treatment (Figure 3A), and that the changes seem to be associated with ER status and PAM50 subtype, as well as response to treatment (pathlogical complete response; pCR). When comparing average delta methylation with response, we see that gain of methylation of these CpGs is associated with better response to the treatment. Taken together, we show that the epigenetic alterations that occur during treatment are different between responders and non-responders and that these differences may be explained by the proliferation-EMT axis through the activity of the transcription factor GRHL2.
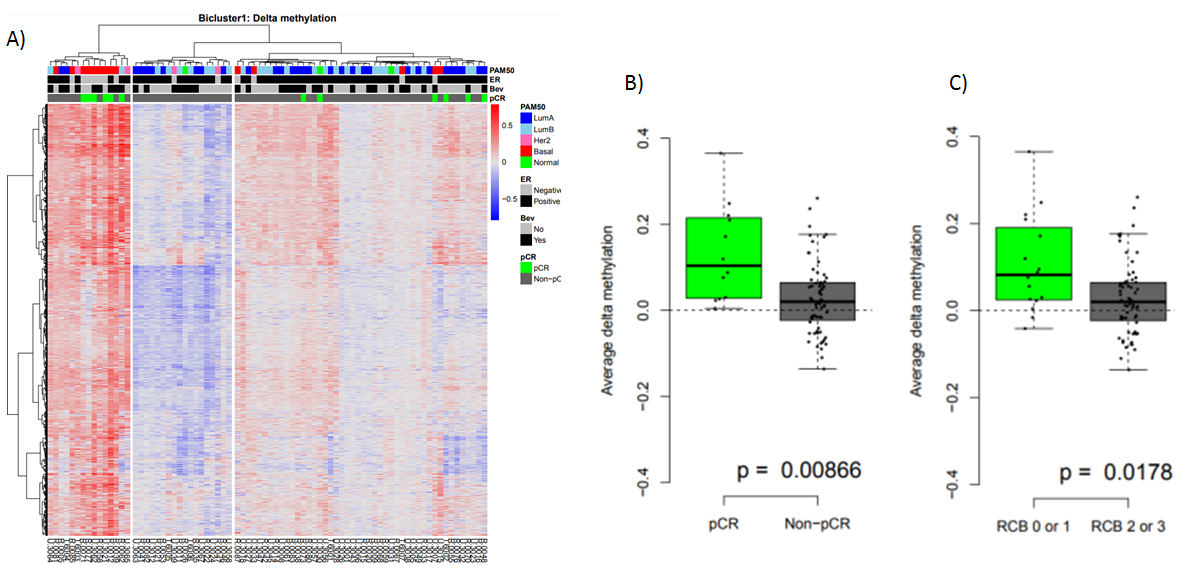
Figure 3: A) Heatmap of delta methylation values. Samples (tumors/patients) are annotated with ER status, PAM50 subtype and response to treatment. B-C) Average delta methylation for the identfied CpGs compared to response (pathological complete response: pCR; RCB: residual cancer burden).