Transcriptomics
Transcriptome data comes in various form and depending on your research question BCF has various analysis strategies to offer.
- Basic mapping to a reference genome with subsequent count estimations with or without normalization
- Simple differential expression between two conditions
- Complex differential expression with multiple conditions or time-series using generalized linear models (GLM)
- Splice variant investigations
- Fusion transcript investigations
- Bulk RNA or spatial RNA deconvolution
- RNA variant calling with expression estimations - variants called de novo or provided upfront
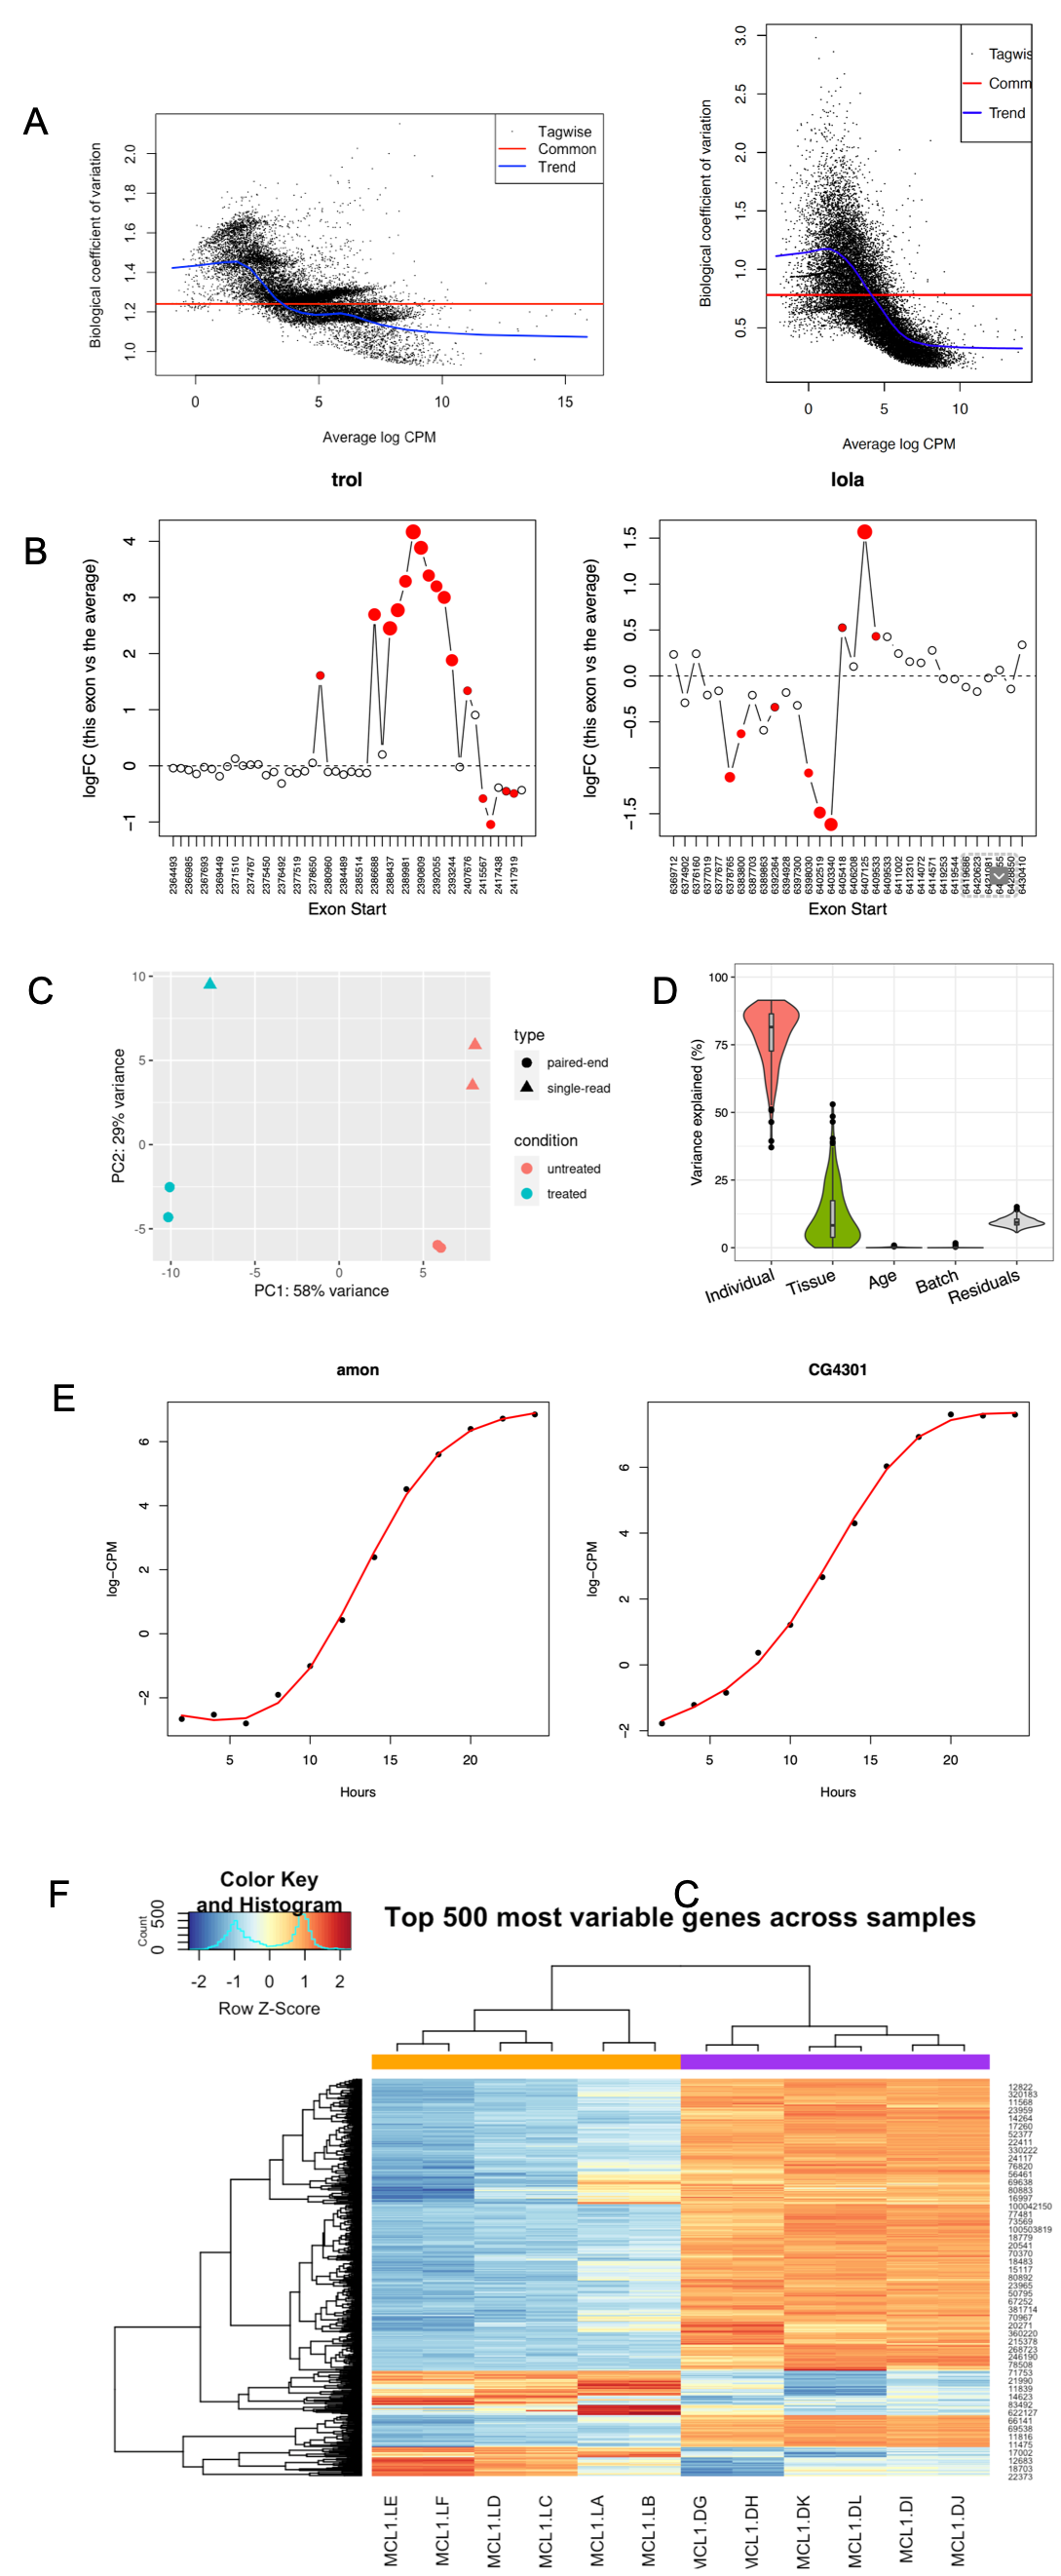
Below are examples of plots derived from analyses that are offered by BCF. In panel A is a plot of estimated biological variation coefficients in a dataset. This particular dataset had strong batch effects, but also a significant proportion of genes where the count variation deviated from the expected negative binominal distribution. In the second part of panel A, the gene counts have been weighted to improve fit towards the expected distribution. Panel B depicts a splice variant analysis where two genes are shown with the relative usage of exons based on exon position. Panel D is a in-depth exploration of various batch effects in a dataset. Here the contributing factor from each piece of metainformation on the variance in the data is calculated. In panel E a classic time-series experiment has been analyzed and the gene expression change over time for two genes has been plotted. In the final panel F, a heatmap of the most variable genes in an experiment is plotted. The clustering is based on gene expression profiles of the genes selected and here the clustering overlaps the two conditions in the experiment.

