Pathway analysis in breast cancer
Genome-wide studies (GWAS) identfied ~200 variants with genome-wide significant association to breast cancer. Whilst these are robustly associated to breast cancer, for many of these variants the underlying biology remains elusive. In collaboration with the Troyanskaya lab at Princeton, we will apply advanced deep learning which will be able to predict putative functional impacts of any of these variants, or for neighboring variants in strong linkage disequilibrium
Figure 1. Output example from ExPecto predicted variant expression effects for the human estrogen receptor gene in various tissues. Figure obtained from ExPecto online tool
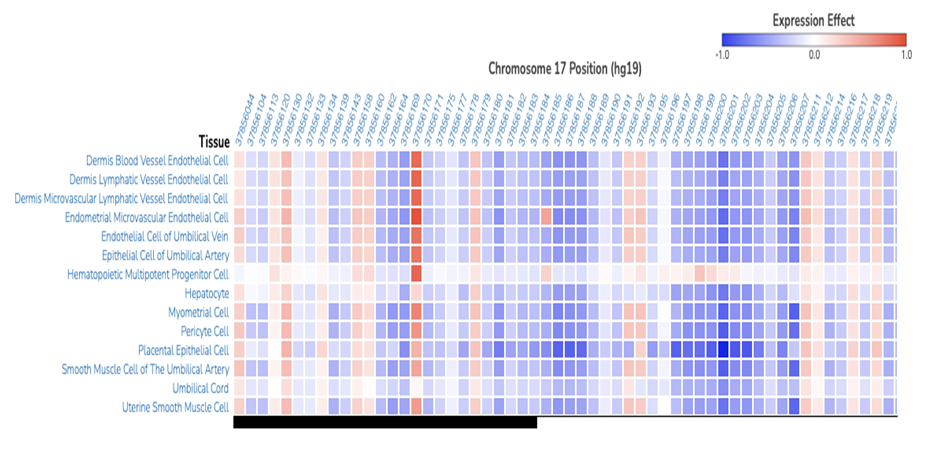
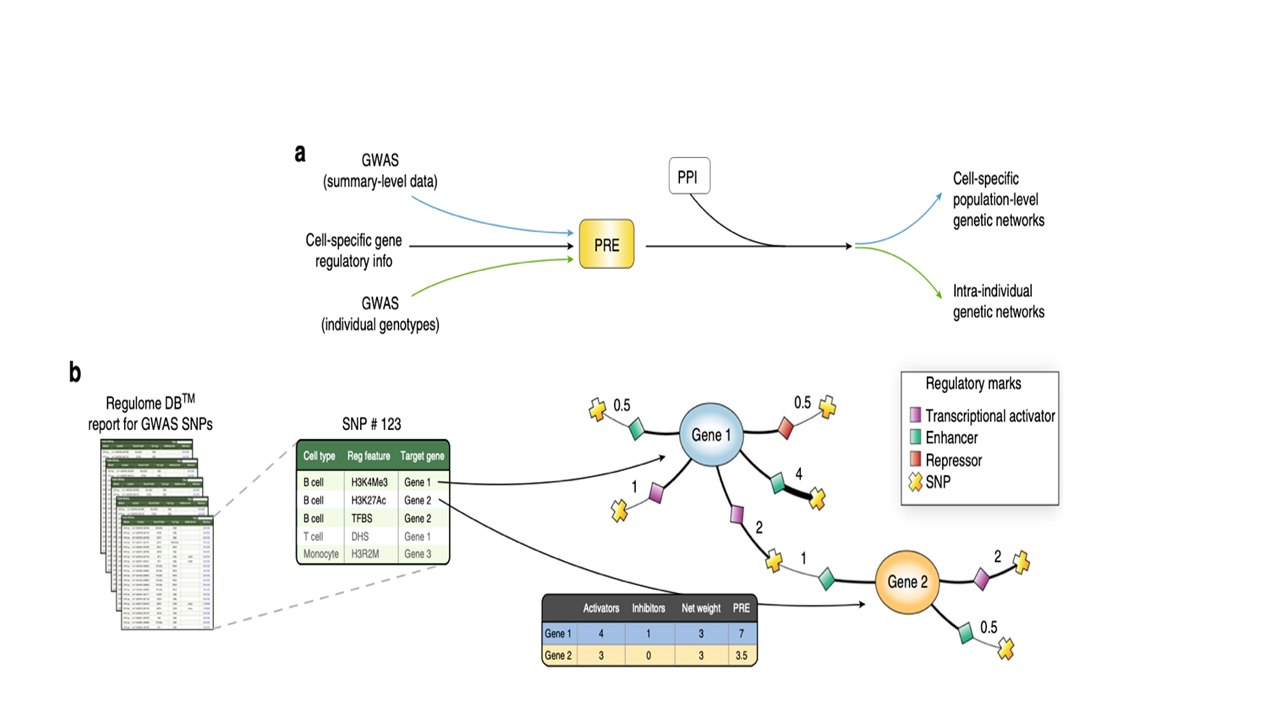
Figure 2. Adapted from IMSGC 2019 A) GWAS signals were integrated with cell-specific regulatory information to compute predicted regulatory effects at both population and individual level, followed by integration with a human protein interactome (PPI) and sub-networks of enriched genes (proteins). Each associated SNP and those in LD were used as query in RegulomeDBto compute a regulatory effect score for each of the cell types analyzed
Do we get additional information by classifying breast cancer tunors at different omic levels:
DNA methylation, DNA copy number alterations, mRNA expression, miRNA expression?
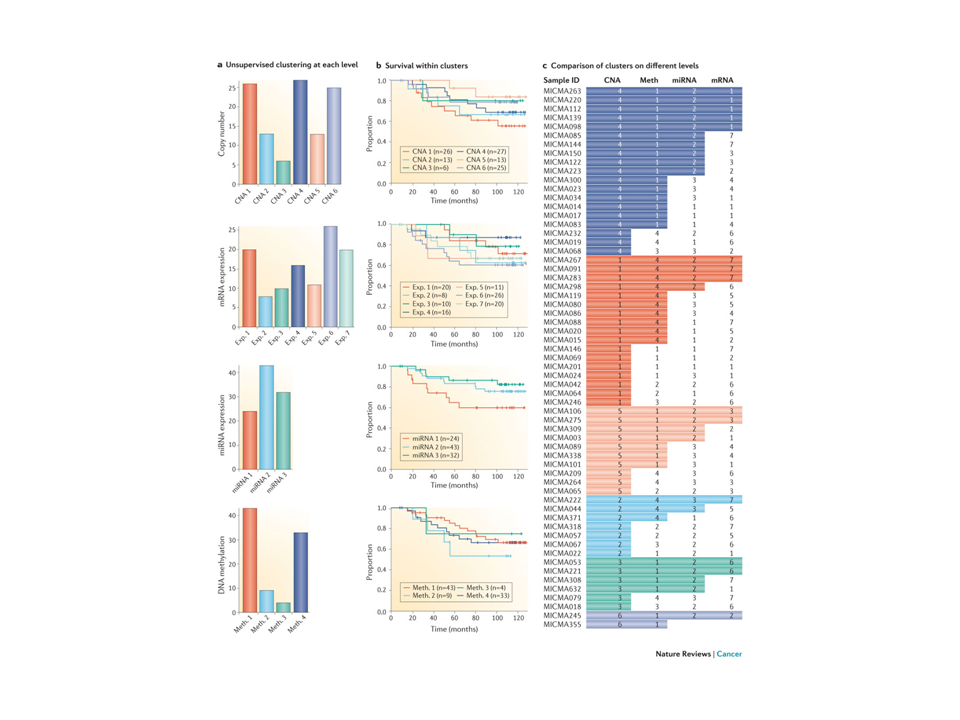
Figure 1. All multiple layers of high-throughput molecular data, including DNA methylation, DNA copy number alterations, mRNA expression, microRNA (miRNA) expression as well as TP53-mutation status, were subjected to integrated analysis using the PAthway Recognition Algorithm using Data Integration on Genomic Models (PARADIGM). This resulted in five clusters (part a) with survival differences (part b) and this was validated in multiple other datasets87. A heat map of integrated pathway levels (IPLs) is shown in part c. FOXM1, forkhead box M1; IL, interleukin: PDGM, PARADIGM cluster; TCR, T cell receptor; TIE2, tyrosine kinase, endothelial. From Principles and methods of integrative genomic analyses in cancer. Nat Rev Cancer. 2014 May;14(5):299-313. doi: 10.1038/nrc3721.
How early in cancer development can we observe deregulated pathways?
 2802-7, Fig. 3.png "Figure 2. Normal to cancer. Heat maps of PARADIGM integrated pathway levels (IPLs) for each dataset. Normal breast, low mammographic density (A); normal breast, high mammographic density (B); DCIS (C); and invasive breast cancer (D; UPPSALA cohort). Each row shows the IPL of a gene or complex across all three cohorts. Members of pathways of interest are labeled by their pathway. Red represents an activated IPL, and blue represents a deactivated IPL.")
Figure 2. Normal to cancer. Heat maps of PARADIGM integrated pathway levels (IPLs) for each dataset. Normal breast, low mammographic density (A); normal breast, high mammographic density (B); DCIS (C); and invasive breast cancer (D; UPPSALA cohort). Each row shows the IPL of a gene or complex across all three cohorts. Members of pathways of interest are labeled by their pathway. Red represents an activated IPL, and blue represents a deactivated IPL. From Integrated molecular profiles of invasive breast tumors and ductal carcinoma in situ (DCIS) reveal differential vascular and interleukin signaling. Proc Natl Acad Sci U S A. 2012 Feb 21;109(8):2802-7. doi: 10.1073/pnas.1108781108. Epub 2011 Sep 9. PMID:21908711, PMCID:PMC3286992, DOI:10.1073/pnas.1108781108
Are the deregulated pathways in breast cancer reproducible?
 2802-7, Fig. 4.png "Figure 3. Validation datasets. Heat maps of PARADIGM integrated pathway levels (IPLs) for each dataset. Discovery dataset (A; MicMa), validation set 1 (B; Chin), and validation set 2 (C; UNC). Each row shows the IPL of a gene or complex across all three cohorts. Members of pathways of interest are labeled by their pathway. Red represents an activated IPL, and blue represents a deactivated IPL. (D) Under each heat map, a silhouette plot illustrates the ratio between distance to centroid of belonging cluster vs. distance to all other members. (E) Survival curves.")
Figure 3. Validation datasets. Heat maps of PARADIGM integrated pathway levels (IPLs) for each dataset. Discovery dataset (A; MicMa), validation set 1 (B; Chin), and validation set 2 (C; UNC). Each row shows the IPL of a gene or complex across all three cohorts. Members of pathways of interest are labeled by their pathway. Red represents an activated IPL, and blue represents a deactivated IPL. (D) Under each heat map, a silhouette plot illustrates the ratio between distance to centroid of belonging cluster vs. distance to all other members. (E) Survival curves. From Integrated molecular profiles of invasive breast tumors and ductal carcinoma in situ (DCIS) reveal differential vascular and interleukin signaling. Proc Natl Acad Sci U S A. 2012 Feb21;109(8):2802-7.doi:10.1073/pnas.1108781108.Epub2011Sep9.PMID:21908711, PMCID:PMC3286992, DOI:10.1073/pnas.1108781108
Can we observe deregulated pathways in responders vs. non responders at
different time points?

Figure 4. Heatmap showing dergulated pathways in chemotherapy arm responders and nonresponders at three time point.

Figure 5. Heatmap showing dergulated pathways in combination arm responders and nonresponders at three time point.
Project members: Surendra Kumar, Thomas Fleischer, Xavier Tekpli, Jovana Klajic, Andliena Tahiri
PhD thesis from project:
1. Himanshu Joshi 03.04.2014; Title of the thesis: Towards pathway and network -based medicine in breast cancer.
2. David Quigley 27.10.2014; Title of the thesis: Rewiring of Genetic Networks in Breast and Skin Cancer Progression.
External colaborators:
- Olga Troyanskaya, Princeton University http://function.princeton.edu/
- Charles Vaske, Nantomics, LA, USA http://five3genomics.com/team/charles-vaske
Recent publications:
1. Principles and methods of integrative genomic analyses in cancer.
Nat Rev Cancer. 2014 May;14(5):299-313. doi: 10.1038/nrc3721.
- PMID:24759209 DOI:10.1038/nrc3721
2. Integrated molecular profiles of invasive breast tumors and ductal carcinoma in situ (DCIS) reveal differential vascular and interleukin signaling.
Proc Natl Acad Sci U S A. 2012 Feb 21;109(8):2802-7. doi: 10.1073/pnas.1108781108. Epub 2011 Sep 9.
- PMID:21908711, PMCID:PMC3286992, DOI:10.1073/pnas.1108781108